Black/African American vs Fijian High School Diploma
COMPARE
Black/African American
Fijian
High School Diploma
High School Diploma Comparison
Blacks/African Americans
Fijians
87.0%
HIGH SCHOOL DIPLOMA
0.2/ 100
METRIC RATING
267th/ 347
METRIC RANK
86.0%
HIGH SCHOOL DIPLOMA
0.0/ 100
METRIC RATING
290th/ 347
METRIC RANK
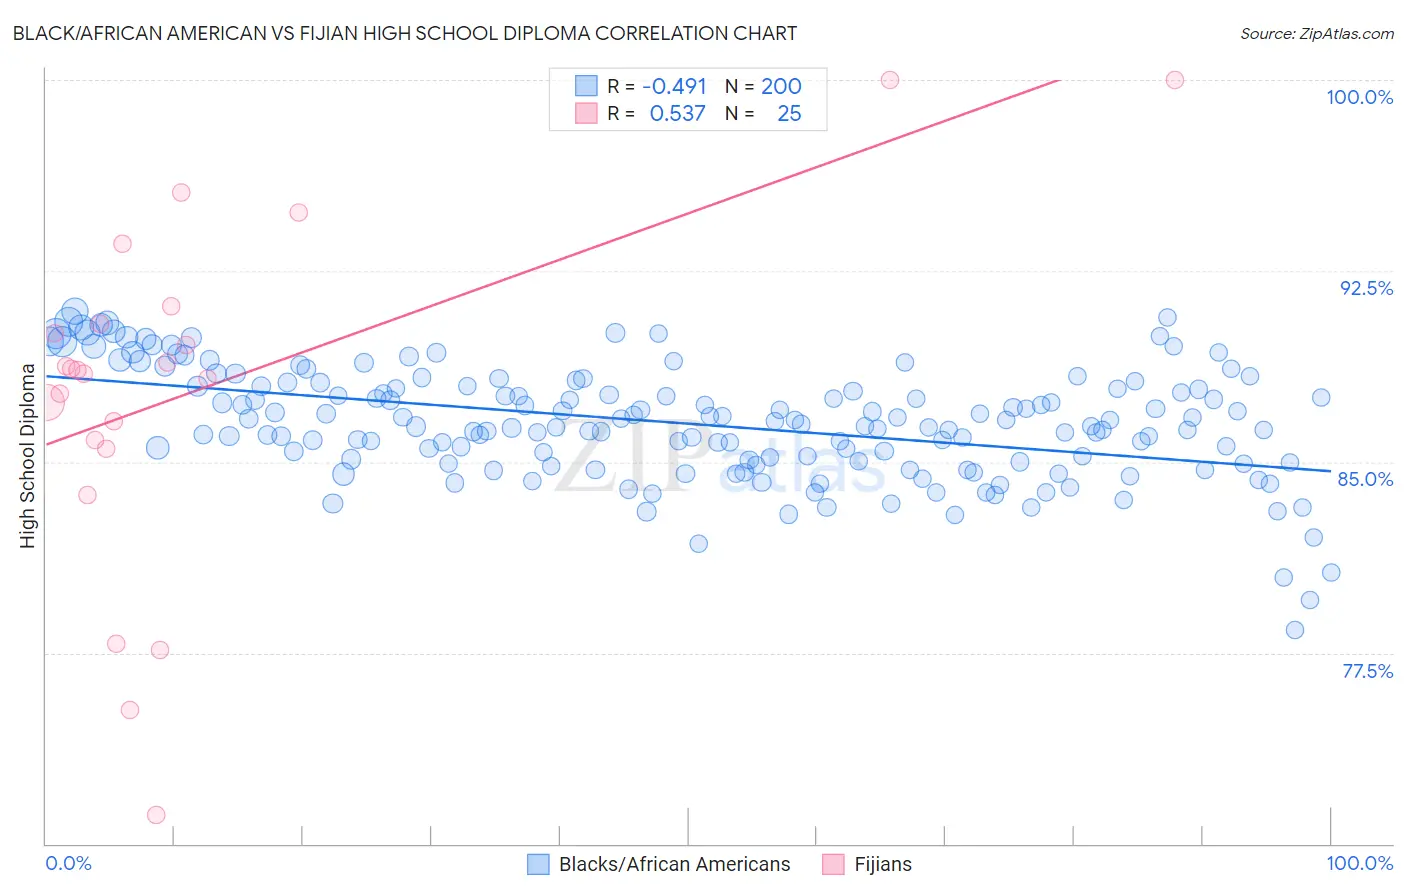
Black/African American vs Fijian High School Diploma Correlation Chart
The statistical analysis conducted on geographies consisting of 566,048,038 people shows a moderate negative correlation between the proportion of Blacks/African Americans and percentage of population with at least high school diploma education in the United States with a correlation coefficient (R) of -0.491 and weighted average of 87.0%. Similarly, the statistical analysis conducted on geographies consisting of 55,948,842 people shows a substantial positive correlation between the proportion of Fijians and percentage of population with at least high school diploma education in the United States with a correlation coefficient (R) of 0.537 and weighted average of 86.0%, a difference of 1.2%.
High School Diploma Correlation Summary
| Measurement | Black/African American | Fijian |
| Minimum | 78.4% | 71.1% |
| Maximum | 90.9% | 100.0% |
| Range | 12.5% | 28.9% |
| Mean | 86.5% | 87.8% |
| Median | 86.4% | 88.6% |
| Interquartile 25% (IQ1) | 85.0% | 85.7% |
| Interquartile 75% (IQ3) | 88.0% | 90.8% |
| Interquartile Range (IQR) | 3.0% | 5.1% |
| Standard Deviation (Sample) | 2.2% | 6.9% |
| Standard Deviation (Population) | 2.2% | 6.7% |
Similar Demographics by High School Diploma
Demographics Similar to Blacks/African Americans by High School Diploma
In terms of high school diploma, the demographic groups most similar to Blacks/African Americans are Immigrants from Congo (87.0%, a difference of 0.010%), Pennsylvania German (87.0%, a difference of 0.030%), Sri Lankan (87.0%, a difference of 0.040%), U.S. Virgin Islander (87.1%, a difference of 0.060%), and Malaysian (87.0%, a difference of 0.060%).
| Demographics | Rating | Rank | High School Diploma |
| Cajuns | 0.4 /100 | #260 | Tragic 87.3% |
| Seminole | 0.4 /100 | #261 | Tragic 87.3% |
| Immigrants | Peru | 0.4 /100 | #262 | Tragic 87.3% |
| Immigrants | South Eastern Asia | 0.3 /100 | #263 | Tragic 87.2% |
| Jamaicans | 0.3 /100 | #264 | Tragic 87.2% |
| U.S. Virgin Islanders | 0.2 /100 | #265 | Tragic 87.1% |
| Immigrants | Congo | 0.2 /100 | #266 | Tragic 87.0% |
| Blacks/African Americans | 0.2 /100 | #267 | Tragic 87.0% |
| Pennsylvania Germans | 0.2 /100 | #268 | Tragic 87.0% |
| Sri Lankans | 0.2 /100 | #269 | Tragic 87.0% |
| Malaysians | 0.2 /100 | #270 | Tragic 87.0% |
| West Indians | 0.1 /100 | #271 | Tragic 86.9% |
| Trinidadians and Tobagonians | 0.1 /100 | #272 | Tragic 86.9% |
| Immigrants | Jamaica | 0.1 /100 | #273 | Tragic 86.9% |
| Bangladeshis | 0.1 /100 | #274 | Tragic 86.9% |
Demographics Similar to Fijians by High School Diploma
In terms of high school diploma, the demographic groups most similar to Fijians are Yup'ik (86.1%, a difference of 0.070%), Haitian (85.9%, a difference of 0.13%), Japanese (85.9%, a difference of 0.14%), British West Indian (85.9%, a difference of 0.16%), and Ute (86.2%, a difference of 0.18%).
| Demographics | Rating | Rank | High School Diploma |
| Immigrants | Barbados | 0.0 /100 | #283 | Tragic 86.4% |
| Paiute | 0.0 /100 | #284 | Tragic 86.4% |
| Immigrants | West Indies | 0.0 /100 | #285 | Tragic 86.2% |
| Immigrants | St. Vincent and the Grenadines | 0.0 /100 | #286 | Tragic 86.2% |
| Ute | 0.0 /100 | #287 | Tragic 86.2% |
| Immigrants | Vietnam | 0.0 /100 | #288 | Tragic 86.2% |
| Yup'ik | 0.0 /100 | #289 | Tragic 86.1% |
| Fijians | 0.0 /100 | #290 | Tragic 86.0% |
| Haitians | 0.0 /100 | #291 | Tragic 85.9% |
| Japanese | 0.0 /100 | #292 | Tragic 85.9% |
| British West Indians | 0.0 /100 | #293 | Tragic 85.9% |
| Immigrants | Fiji | 0.0 /100 | #294 | Tragic 85.8% |
| Immigrants | Immigrants | 0.0 /100 | #295 | Tragic 85.8% |
| Immigrants | Cambodia | 0.0 /100 | #296 | Tragic 85.6% |
| Immigrants | Grenada | 0.0 /100 | #297 | Tragic 85.6% |