Black/African American vs Immigrants from Sweden High School Diploma
COMPARE
Black/African American
Immigrants from Sweden
High School Diploma
High School Diploma Comparison
Blacks/African Americans
Immigrants from Sweden
87.0%
HIGH SCHOOL DIPLOMA
0.2/ 100
METRIC RATING
267th/ 347
METRIC RANK
91.1%
HIGH SCHOOL DIPLOMA
99.7/ 100
METRIC RATING
52nd/ 347
METRIC RANK
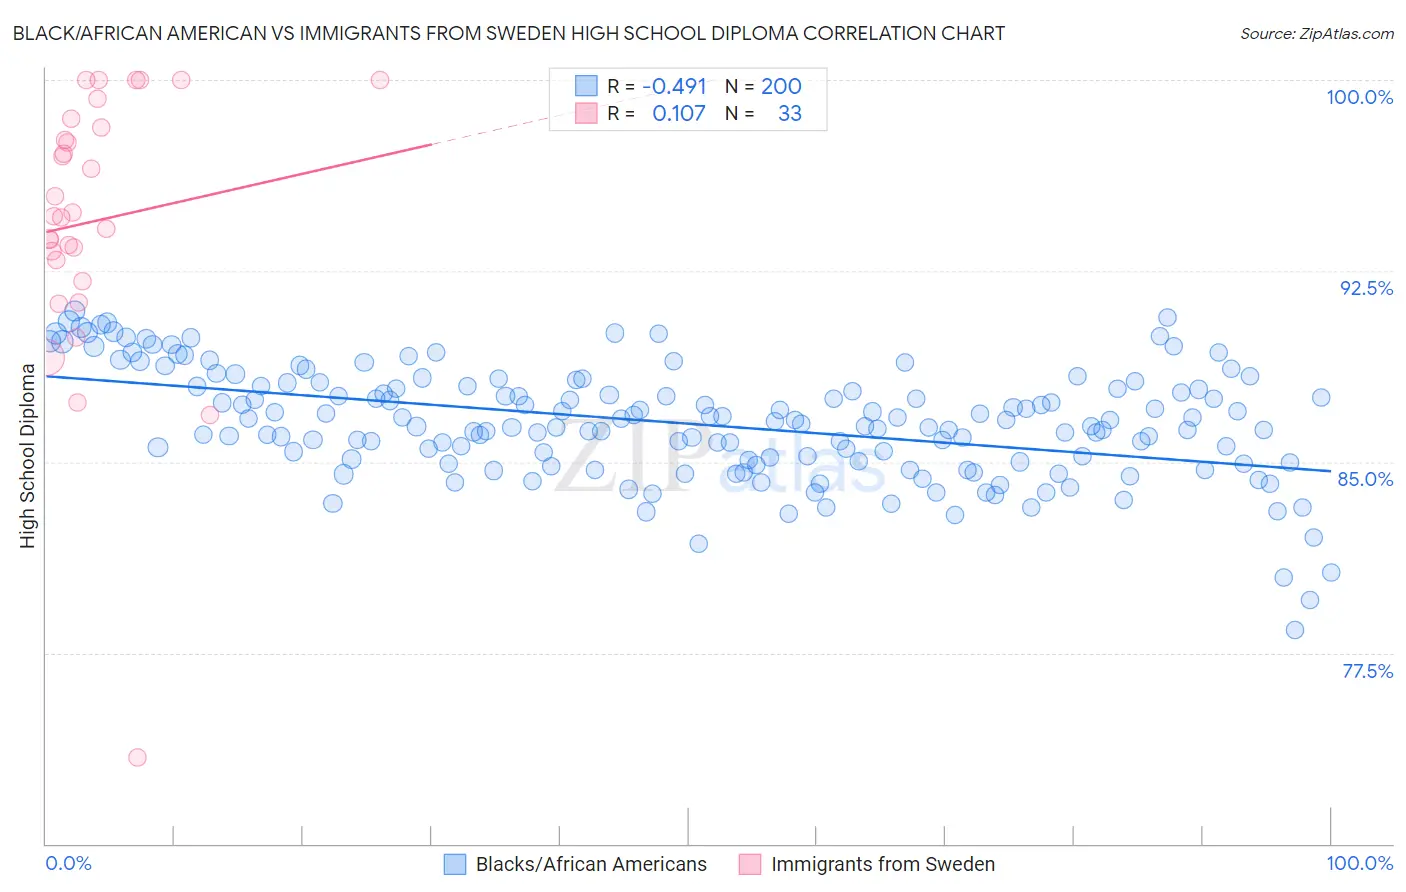
Black/African American vs Immigrants from Sweden High School Diploma Correlation Chart
The statistical analysis conducted on geographies consisting of 566,048,038 people shows a moderate negative correlation between the proportion of Blacks/African Americans and percentage of population with at least high school diploma education in the United States with a correlation coefficient (R) of -0.491 and weighted average of 87.0%. Similarly, the statistical analysis conducted on geographies consisting of 164,737,092 people shows a poor positive correlation between the proportion of Immigrants from Sweden and percentage of population with at least high school diploma education in the United States with a correlation coefficient (R) of 0.107 and weighted average of 91.1%, a difference of 4.7%.
High School Diploma Correlation Summary
| Measurement | Black/African American | Immigrants from Sweden |
| Minimum | 78.4% | 73.4% |
| Maximum | 90.9% | 100.0% |
| Range | 12.5% | 26.6% |
| Mean | 86.5% | 94.5% |
| Median | 86.4% | 94.6% |
| Interquartile 25% (IQ1) | 85.0% | 92.5% |
| Interquartile 75% (IQ3) | 88.0% | 98.3% |
| Interquartile Range (IQR) | 3.0% | 5.8% |
| Standard Deviation (Sample) | 2.2% | 5.3% |
| Standard Deviation (Population) | 2.2% | 5.3% |
Similar Demographics by High School Diploma
Demographics Similar to Blacks/African Americans by High School Diploma
In terms of high school diploma, the demographic groups most similar to Blacks/African Americans are Immigrants from Congo (87.0%, a difference of 0.010%), Pennsylvania German (87.0%, a difference of 0.030%), Sri Lankan (87.0%, a difference of 0.040%), U.S. Virgin Islander (87.1%, a difference of 0.060%), and Malaysian (87.0%, a difference of 0.060%).
| Demographics | Rating | Rank | High School Diploma |
| Cajuns | 0.4 /100 | #260 | Tragic 87.3% |
| Seminole | 0.4 /100 | #261 | Tragic 87.3% |
| Immigrants | Peru | 0.4 /100 | #262 | Tragic 87.3% |
| Immigrants | South Eastern Asia | 0.3 /100 | #263 | Tragic 87.2% |
| Jamaicans | 0.3 /100 | #264 | Tragic 87.2% |
| U.S. Virgin Islanders | 0.2 /100 | #265 | Tragic 87.1% |
| Immigrants | Congo | 0.2 /100 | #266 | Tragic 87.0% |
| Blacks/African Americans | 0.2 /100 | #267 | Tragic 87.0% |
| Pennsylvania Germans | 0.2 /100 | #268 | Tragic 87.0% |
| Sri Lankans | 0.2 /100 | #269 | Tragic 87.0% |
| Malaysians | 0.2 /100 | #270 | Tragic 87.0% |
| West Indians | 0.1 /100 | #271 | Tragic 86.9% |
| Trinidadians and Tobagonians | 0.1 /100 | #272 | Tragic 86.9% |
| Immigrants | Jamaica | 0.1 /100 | #273 | Tragic 86.9% |
| Bangladeshis | 0.1 /100 | #274 | Tragic 86.9% |
Demographics Similar to Immigrants from Sweden by High School Diploma
In terms of high school diploma, the demographic groups most similar to Immigrants from Sweden are New Zealander (91.1%, a difference of 0.0%), Immigrants from Belgium (91.1%, a difference of 0.0%), Macedonian (91.1%, a difference of 0.020%), Serbian (91.1%, a difference of 0.030%), and Welsh (91.2%, a difference of 0.050%).
| Demographics | Rating | Rank | High School Diploma |
| Turks | 99.8 /100 | #45 | Exceptional 91.2% |
| Greeks | 99.8 /100 | #46 | Exceptional 91.2% |
| Australians | 99.8 /100 | #47 | Exceptional 91.2% |
| Belgians | 99.8 /100 | #48 | Exceptional 91.2% |
| Bhutanese | 99.8 /100 | #49 | Exceptional 91.2% |
| Welsh | 99.8 /100 | #50 | Exceptional 91.2% |
| New Zealanders | 99.7 /100 | #51 | Exceptional 91.1% |
| Immigrants | Sweden | 99.7 /100 | #52 | Exceptional 91.1% |
| Immigrants | Belgium | 99.7 /100 | #53 | Exceptional 91.1% |
| Macedonians | 99.7 /100 | #54 | Exceptional 91.1% |
| Serbians | 99.7 /100 | #55 | Exceptional 91.1% |
| Immigrants | Canada | 99.7 /100 | #56 | Exceptional 91.1% |
| Zimbabweans | 99.7 /100 | #57 | Exceptional 91.1% |
| Slavs | 99.7 /100 | #58 | Exceptional 91.0% |
| Immigrants | North America | 99.7 /100 | #59 | Exceptional 91.0% |