Black/African American vs Immigrants from Ecuador 7th Grade
COMPARE
Black/African American
Immigrants from Ecuador
7th Grade
7th Grade Comparison
Blacks/African Americans
Immigrants from Ecuador
96.0%
7TH GRADE
49.5/ 100
METRIC RATING
175th/ 347
METRIC RANK
93.7%
7TH GRADE
0.0/ 100
METRIC RATING
318th/ 347
METRIC RANK
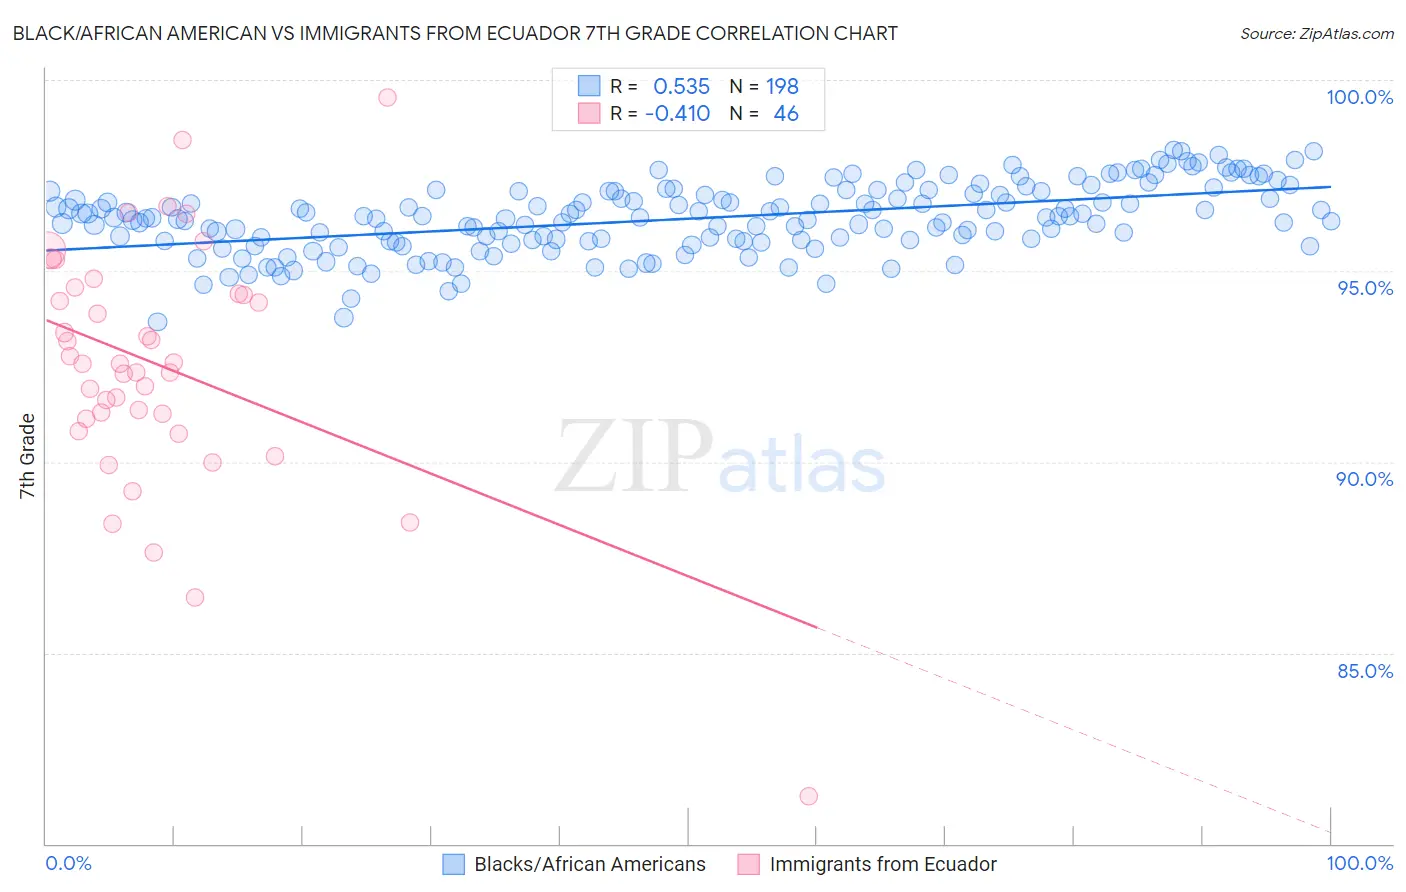
Black/African American vs Immigrants from Ecuador 7th Grade Correlation Chart
The statistical analysis conducted on geographies consisting of 561,177,341 people shows a substantial positive correlation between the proportion of Blacks/African Americans and percentage of population with at least 7th grade education in the United States with a correlation coefficient (R) of 0.535 and weighted average of 96.0%. Similarly, the statistical analysis conducted on geographies consisting of 270,907,929 people shows a moderate negative correlation between the proportion of Immigrants from Ecuador and percentage of population with at least 7th grade education in the United States with a correlation coefficient (R) of -0.410 and weighted average of 93.7%, a difference of 2.5%.
7th Grade Correlation Summary
| Measurement | Black/African American | Immigrants from Ecuador |
| Minimum | 93.7% | 81.2% |
| Maximum | 98.2% | 99.5% |
| Range | 4.5% | 18.3% |
| Mean | 96.4% | 92.5% |
| Median | 96.4% | 92.6% |
| Interquartile 25% (IQ1) | 95.8% | 91.1% |
| Interquartile 75% (IQ3) | 97.1% | 94.4% |
| Interquartile Range (IQR) | 1.3% | 3.3% |
| Standard Deviation (Sample) | 0.90% | 3.2% |
| Standard Deviation (Population) | 0.89% | 3.2% |
Similar Demographics by 7th Grade
Demographics Similar to Blacks/African Americans by 7th Grade
In terms of 7th grade, the demographic groups most similar to Blacks/African Americans are Mongolian (96.0%, a difference of 0.0%), Chilean (96.0%, a difference of 0.0%), Immigrants from Korea (96.0%, a difference of 0.0%), Venezuelan (96.0%, a difference of 0.010%), and Immigrants from Albania (96.0%, a difference of 0.010%).
| Demographics | Rating | Rank | 7th Grade |
| Immigrants | Poland | 59.0 /100 | #168 | Average 96.1% |
| Ute | 55.8 /100 | #169 | Average 96.1% |
| Immigrants | Ukraine | 55.0 /100 | #170 | Average 96.1% |
| Egyptians | 54.2 /100 | #171 | Average 96.1% |
| Venezuelans | 51.4 /100 | #172 | Average 96.0% |
| Immigrants | Albania | 50.4 /100 | #173 | Average 96.0% |
| Mongolians | 50.0 /100 | #174 | Average 96.0% |
| Blacks/African Americans | 49.5 /100 | #175 | Average 96.0% |
| Chileans | 49.3 /100 | #176 | Average 96.0% |
| Immigrants | Korea | 49.2 /100 | #177 | Average 96.0% |
| Marshallese | 48.4 /100 | #178 | Average 96.0% |
| Immigrants | Iran | 47.8 /100 | #179 | Average 96.0% |
| Immigrants | Brazil | 46.8 /100 | #180 | Average 96.0% |
| Pakistanis | 44.5 /100 | #181 | Average 96.0% |
| Iraqis | 41.2 /100 | #182 | Average 96.0% |
Demographics Similar to Immigrants from Ecuador by 7th Grade
In terms of 7th grade, the demographic groups most similar to Immigrants from Ecuador are Immigrants from Cambodia (93.7%, a difference of 0.030%), Immigrants from Cuba (93.8%, a difference of 0.080%), Immigrants from Vietnam (93.9%, a difference of 0.16%), Vietnamese (93.9%, a difference of 0.19%), and Immigrants from Fiji (93.5%, a difference of 0.21%).
| Demographics | Rating | Rank | 7th Grade |
| Puerto Ricans | 0.0 /100 | #311 | Tragic 94.0% |
| Immigrants | Immigrants | 0.0 /100 | #312 | Tragic 94.0% |
| Immigrants | Bangladesh | 0.0 /100 | #313 | Tragic 94.0% |
| Japanese | 0.0 /100 | #314 | Tragic 94.0% |
| Vietnamese | 0.0 /100 | #315 | Tragic 93.9% |
| Immigrants | Vietnam | 0.0 /100 | #316 | Tragic 93.9% |
| Immigrants | Cuba | 0.0 /100 | #317 | Tragic 93.8% |
| Immigrants | Ecuador | 0.0 /100 | #318 | Tragic 93.7% |
| Immigrants | Cambodia | 0.0 /100 | #319 | Tragic 93.7% |
| Immigrants | Fiji | 0.0 /100 | #320 | Tragic 93.5% |
| Belizeans | 0.0 /100 | #321 | Tragic 93.5% |
| Nicaraguans | 0.0 /100 | #322 | Tragic 93.5% |
| Immigrants | Belize | 0.0 /100 | #323 | Tragic 93.4% |
| Dominicans | 0.0 /100 | #324 | Tragic 93.3% |
| Central American Indians | 0.0 /100 | #325 | Tragic 93.3% |