Basque vs Welsh In Labor Force | Age > 16
COMPARE
Basque
Welsh
In Labor Force | Age > 16
In Labor Force | Age > 16 Comparison
Basques
Welsh
64.2%
IN LABOR FORCE | AGE > 16
0.7/ 100
METRIC RATING
261st/ 347
METRIC RANK
64.0%
IN LABOR FORCE | AGE > 16
0.2/ 100
METRIC RATING
279th/ 347
METRIC RANK
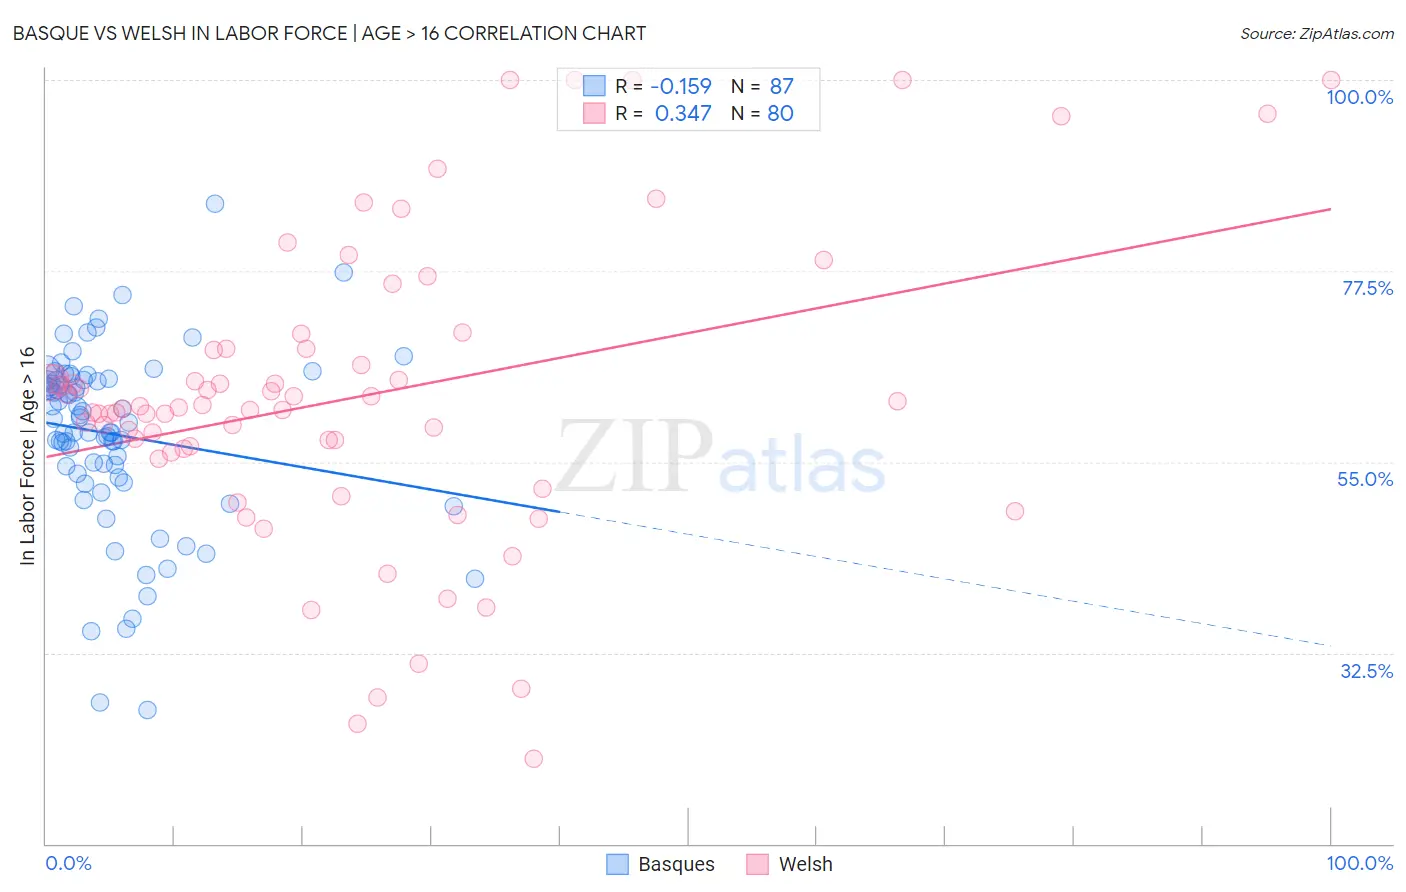
Basque vs Welsh In Labor Force | Age > 16 Correlation Chart
The statistical analysis conducted on geographies consisting of 165,779,743 people shows a poor negative correlation between the proportion of Basques and labor force participation rate among population ages 16 and over in the United States with a correlation coefficient (R) of -0.159 and weighted average of 64.2%. Similarly, the statistical analysis conducted on geographies consisting of 528,607,710 people shows a mild positive correlation between the proportion of Welsh and labor force participation rate among population ages 16 and over in the United States with a correlation coefficient (R) of 0.347 and weighted average of 64.0%, a difference of 0.32%.
In Labor Force | Age > 16 Correlation Summary
| Measurement | Basque | Welsh |
| Minimum | 25.7% | 20.0% |
| Maximum | 85.4% | 100.0% |
| Range | 59.7% | 80.0% |
| Mean | 58.2% | 62.6% |
| Median | 60.1% | 61.3% |
| Interquartile 25% (IQ1) | 53.6% | 56.3% |
| Interquartile 75% (IQ3) | 64.7% | 68.3% |
| Interquartile Range (IQR) | 11.1% | 12.0% |
| Standard Deviation (Sample) | 10.6% | 17.5% |
| Standard Deviation (Population) | 10.5% | 17.3% |
Demographics Similar to Basques and Welsh by In Labor Force | Age > 16
In terms of in labor force | age > 16, the demographic groups most similar to Basques are Marshallese (64.2%, a difference of 0.0%), Finnish (64.2%, a difference of 0.010%), Bahamian (64.2%, a difference of 0.030%), Dutch (64.2%, a difference of 0.050%), and Cuban (64.2%, a difference of 0.090%). Similarly, the demographic groups most similar to Welsh are Immigrants from St. Vincent and the Grenadines (64.0%, a difference of 0.010%), Assyrian/Chaldean/Syriac (64.0%, a difference of 0.030%), Immigrants from Bahamas (64.0%, a difference of 0.060%), Immigrants from Cuba (64.1%, a difference of 0.090%), and Mexican (64.1%, a difference of 0.090%).
| Demographics | Rating | Rank | In Labor Force | Age > 16 |
| Marshallese | 0.7 /100 | #260 | Tragic 64.2% |
| Basques | 0.7 /100 | #261 | Tragic 64.2% |
| Finns | 0.7 /100 | #262 | Tragic 64.2% |
| Bahamians | 0.6 /100 | #263 | Tragic 64.2% |
| Dutch | 0.6 /100 | #264 | Tragic 64.2% |
| Cubans | 0.5 /100 | #265 | Tragic 64.2% |
| Immigrants | England | 0.5 /100 | #266 | Tragic 64.2% |
| Canadians | 0.5 /100 | #267 | Tragic 64.1% |
| Spaniards | 0.5 /100 | #268 | Tragic 64.1% |
| Irish | 0.4 /100 | #269 | Tragic 64.1% |
| Guyanese | 0.4 /100 | #270 | Tragic 64.1% |
| Dominicans | 0.4 /100 | #271 | Tragic 64.1% |
| Native Hawaiians | 0.3 /100 | #272 | Tragic 64.1% |
| Hmong | 0.3 /100 | #273 | Tragic 64.1% |
| Immigrants | Cuba | 0.3 /100 | #274 | Tragic 64.1% |
| Mexicans | 0.3 /100 | #275 | Tragic 64.1% |
| French American Indians | 0.3 /100 | #276 | Tragic 64.1% |
| Immigrants | Bahamas | 0.3 /100 | #277 | Tragic 64.0% |
| Assyrians/Chaldeans/Syriacs | 0.3 /100 | #278 | Tragic 64.0% |
| Welsh | 0.2 /100 | #279 | Tragic 64.0% |
| Immigrants | St. Vincent and the Grenadines | 0.2 /100 | #280 | Tragic 64.0% |