Macedonian vs Welsh Bachelor's Degree
COMPARE
Macedonian
Welsh
Bachelor's Degree
Bachelor's Degree Comparison
Macedonians
Welsh
41.4%
BACHELOR'S DEGREE
98.1/ 100
METRIC RATING
100th/ 347
METRIC RANK
37.0%
BACHELOR'S DEGREE
29.1/ 100
METRIC RATING
198th/ 347
METRIC RANK
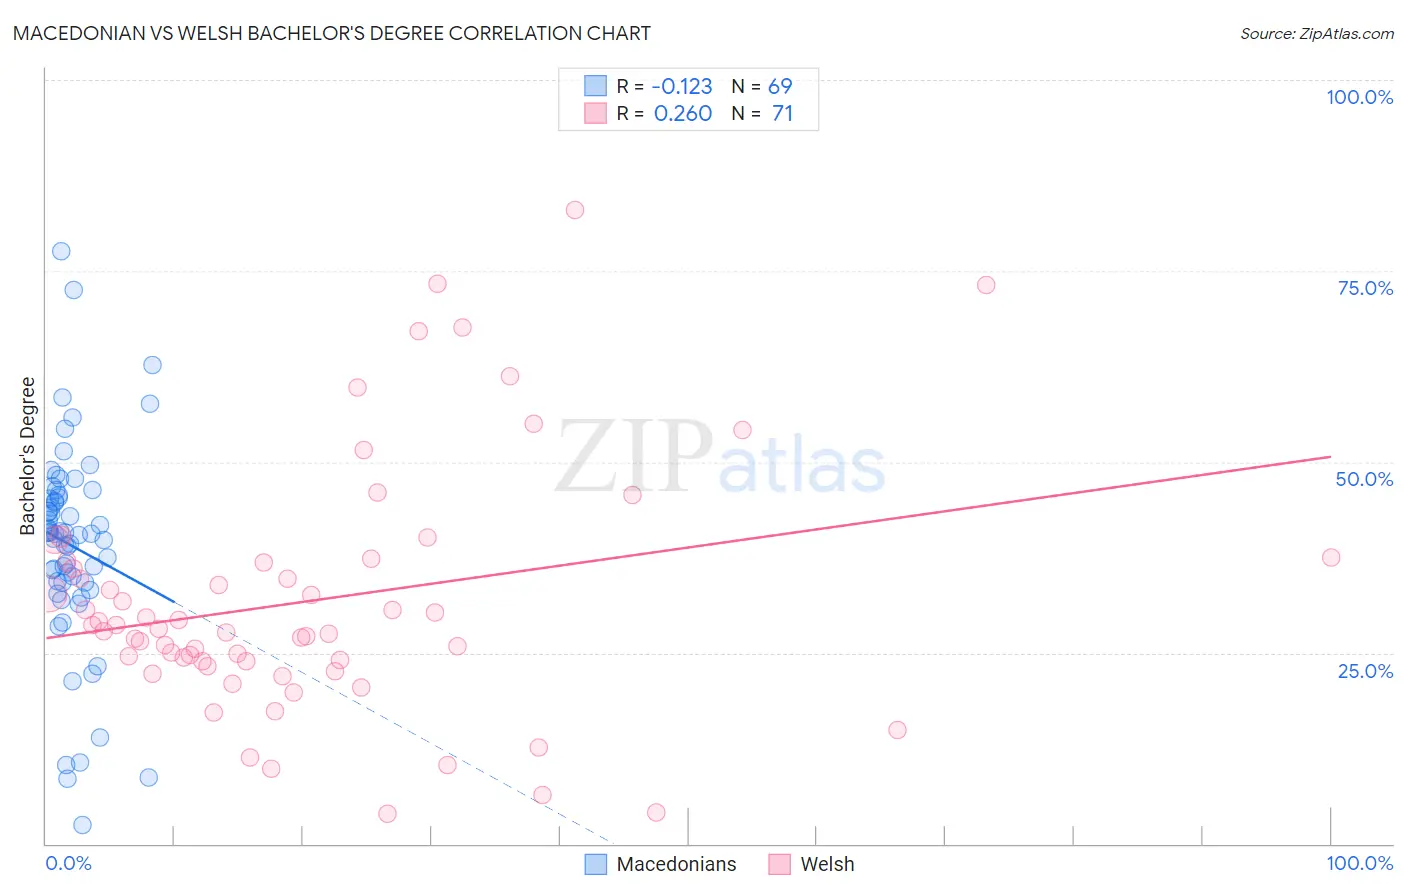
Macedonian vs Welsh Bachelor's Degree Correlation Chart
The statistical analysis conducted on geographies consisting of 132,656,802 people shows a poor negative correlation between the proportion of Macedonians and percentage of population with at least bachelor's degree education in the United States with a correlation coefficient (R) of -0.123 and weighted average of 41.4%. Similarly, the statistical analysis conducted on geographies consisting of 528,521,285 people shows a weak positive correlation between the proportion of Welsh and percentage of population with at least bachelor's degree education in the United States with a correlation coefficient (R) of 0.260 and weighted average of 37.0%, a difference of 12.0%.
Bachelor's Degree Correlation Summary
| Measurement | Macedonian | Welsh |
| Minimum | 2.5% | 3.9% |
| Maximum | 77.6% | 83.0% |
| Range | 75.1% | 79.1% |
| Mean | 39.1% | 31.9% |
| Median | 40.7% | 28.2% |
| Interquartile 25% (IQ1) | 34.2% | 23.9% |
| Interquartile 75% (IQ3) | 45.5% | 36.9% |
| Interquartile Range (IQR) | 11.3% | 13.0% |
| Standard Deviation (Sample) | 13.5% | 16.3% |
| Standard Deviation (Population) | 13.4% | 16.2% |
Similar Demographics by Bachelor's Degree
Demographics Similar to Macedonians by Bachelor's Degree
In terms of bachelor's degree, the demographic groups most similar to Macedonians are Immigrants from England (41.4%, a difference of 0.030%), Immigrants from Morocco (41.4%, a difference of 0.030%), Immigrants from Ukraine (41.5%, a difference of 0.26%), Immigrants from Italy (41.3%, a difference of 0.29%), and Romanian (41.6%, a difference of 0.37%).
| Demographics | Rating | Rank | Bachelor's Degree |
| Immigrants | Canada | 98.6 /100 | #93 | Exceptional 41.7% |
| Immigrants | Nepal | 98.6 /100 | #94 | Exceptional 41.7% |
| Immigrants | North America | 98.5 /100 | #95 | Exceptional 41.7% |
| Immigrants | Moldova | 98.4 /100 | #96 | Exceptional 41.6% |
| Romanians | 98.4 /100 | #97 | Exceptional 41.6% |
| Immigrants | Ukraine | 98.3 /100 | #98 | Exceptional 41.5% |
| Immigrants | England | 98.1 /100 | #99 | Exceptional 41.4% |
| Macedonians | 98.1 /100 | #100 | Exceptional 41.4% |
| Immigrants | Morocco | 98.0 /100 | #101 | Exceptional 41.4% |
| Immigrants | Italy | 97.8 /100 | #102 | Exceptional 41.3% |
| Chileans | 97.5 /100 | #103 | Exceptional 41.2% |
| Jordanians | 97.4 /100 | #104 | Exceptional 41.2% |
| Syrians | 97.4 /100 | #105 | Exceptional 41.1% |
| Alsatians | 97.0 /100 | #106 | Exceptional 41.0% |
| Northern Europeans | 96.8 /100 | #107 | Exceptional 41.0% |
Demographics Similar to Welsh by Bachelor's Degree
In terms of bachelor's degree, the demographic groups most similar to Welsh are Czechoslovakian (37.0%, a difference of 0.010%), Celtic (37.0%, a difference of 0.050%), Korean (37.0%, a difference of 0.080%), Belgian (37.0%, a difference of 0.10%), and Immigrants from Costa Rica (36.9%, a difference of 0.21%).
| Demographics | Rating | Rank | Bachelor's Degree |
| Nigerians | 33.9 /100 | #191 | Fair 37.2% |
| Immigrants | Vietnam | 32.1 /100 | #192 | Fair 37.1% |
| Yugoslavians | 31.5 /100 | #193 | Fair 37.1% |
| Belgians | 29.9 /100 | #194 | Fair 37.0% |
| Koreans | 29.8 /100 | #195 | Fair 37.0% |
| Celtics | 29.5 /100 | #196 | Fair 37.0% |
| Czechoslovakians | 29.2 /100 | #197 | Fair 37.0% |
| Welsh | 29.1 /100 | #198 | Fair 37.0% |
| Immigrants | Costa Rica | 27.4 /100 | #199 | Fair 36.9% |
| Immigrants | Ghana | 27.4 /100 | #200 | Fair 36.9% |
| Immigrants | South Eastern Asia | 25.4 /100 | #201 | Fair 36.8% |
| Immigrants | Zaire | 25.3 /100 | #202 | Fair 36.8% |
| Immigrants | Nigeria | 23.1 /100 | #203 | Fair 36.7% |
| Immigrants | Immigrants | 22.8 /100 | #204 | Fair 36.7% |
| Finns | 22.2 /100 | #205 | Fair 36.7% |