Ugandan vs Immigrants from Lithuania Bachelor's Degree
COMPARE
Ugandan
Immigrants from Lithuania
Bachelor's Degree
Bachelor's Degree Comparison
Ugandans
Immigrants from Lithuania
40.8%
BACHELOR'S DEGREE
96.3/ 100
METRIC RATING
112th/ 347
METRIC RANK
44.6%
BACHELOR'S DEGREE
99.9/ 100
METRIC RATING
44th/ 347
METRIC RANK
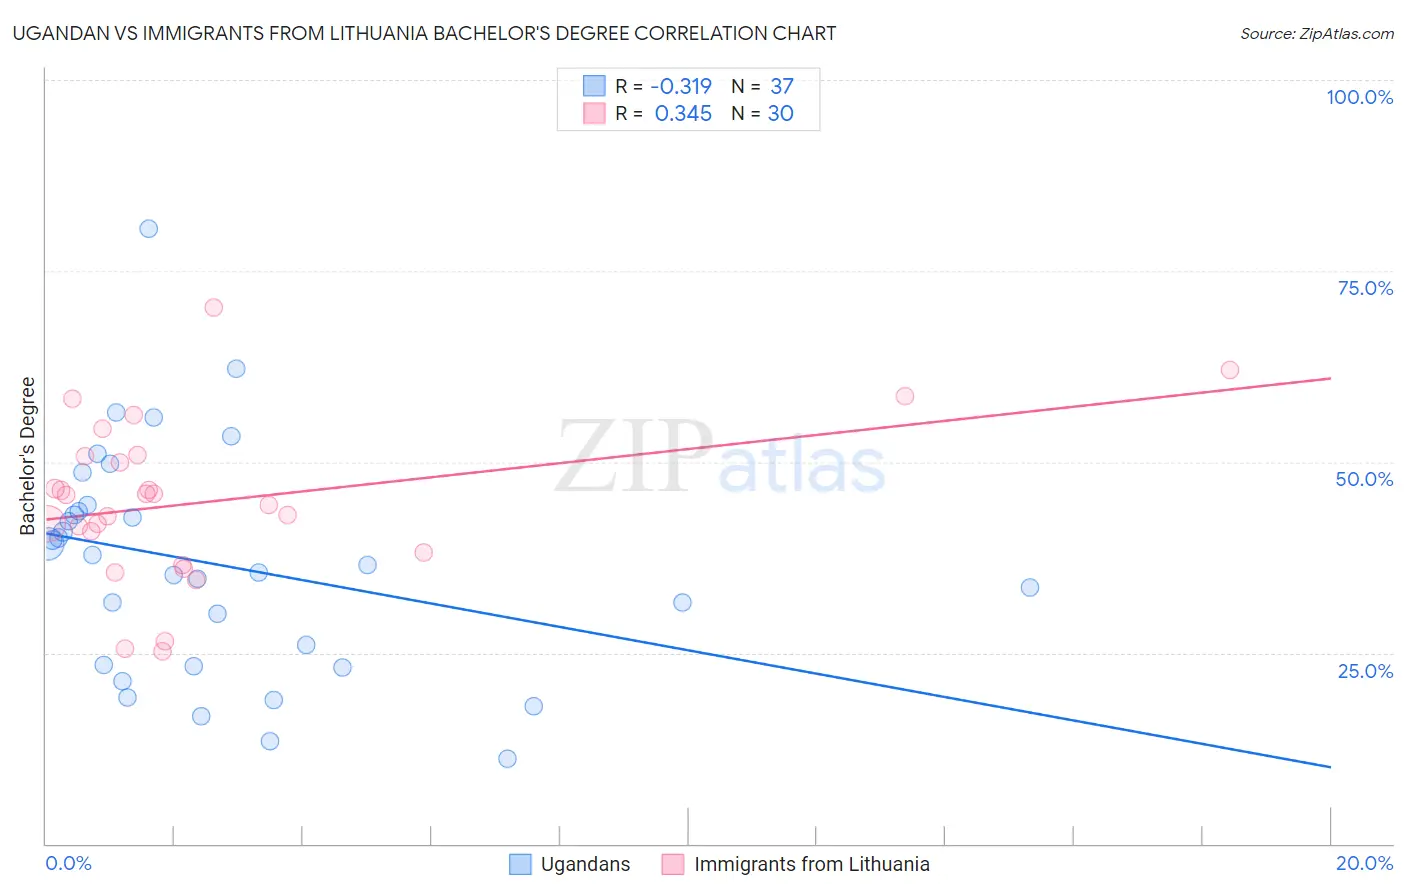
Ugandan vs Immigrants from Lithuania Bachelor's Degree Correlation Chart
The statistical analysis conducted on geographies consisting of 94,016,399 people shows a mild negative correlation between the proportion of Ugandans and percentage of population with at least bachelor's degree education in the United States with a correlation coefficient (R) of -0.319 and weighted average of 40.8%. Similarly, the statistical analysis conducted on geographies consisting of 117,722,731 people shows a mild positive correlation between the proportion of Immigrants from Lithuania and percentage of population with at least bachelor's degree education in the United States with a correlation coefficient (R) of 0.345 and weighted average of 44.6%, a difference of 9.3%.
Bachelor's Degree Correlation Summary
| Measurement | Ugandan | Immigrants from Lithuania |
| Minimum | 11.1% | 25.2% |
| Maximum | 80.5% | 70.2% |
| Range | 69.4% | 45.0% |
| Mean | 36.6% | 44.7% |
| Median | 36.6% | 45.0% |
| Interquartile 25% (IQ1) | 23.3% | 38.1% |
| Interquartile 75% (IQ3) | 43.9% | 50.7% |
| Interquartile Range (IQR) | 20.6% | 12.6% |
| Standard Deviation (Sample) | 14.9% | 10.5% |
| Standard Deviation (Population) | 14.7% | 10.3% |
Similar Demographics by Bachelor's Degree
Demographics Similar to Ugandans by Bachelor's Degree
In terms of bachelor's degree, the demographic groups most similar to Ugandans are Brazilian (40.8%, a difference of 0.040%), Immigrants from Chile (40.8%, a difference of 0.050%), Afghan (40.8%, a difference of 0.070%), Albanian (40.9%, a difference of 0.090%), and Arab (40.9%, a difference of 0.17%).
| Demographics | Rating | Rank | Bachelor's Degree |
| Syrians | 97.4 /100 | #105 | Exceptional 41.1% |
| Alsatians | 97.0 /100 | #106 | Exceptional 41.0% |
| Northern Europeans | 96.8 /100 | #107 | Exceptional 41.0% |
| Ukrainians | 96.6 /100 | #108 | Exceptional 40.9% |
| Arabs | 96.6 /100 | #109 | Exceptional 40.9% |
| Albanians | 96.5 /100 | #110 | Exceptional 40.9% |
| Immigrants | Chile | 96.4 /100 | #111 | Exceptional 40.8% |
| Ugandans | 96.3 /100 | #112 | Exceptional 40.8% |
| Brazilians | 96.3 /100 | #113 | Exceptional 40.8% |
| Afghans | 96.2 /100 | #114 | Exceptional 40.8% |
| Palestinians | 95.8 /100 | #115 | Exceptional 40.7% |
| Immigrants | Uganda | 95.7 /100 | #116 | Exceptional 40.7% |
| Austrians | 95.5 /100 | #117 | Exceptional 40.6% |
| Croatians | 95.5 /100 | #118 | Exceptional 40.6% |
| Immigrants | Syria | 94.9 /100 | #119 | Exceptional 40.5% |
Demographics Similar to Immigrants from Lithuania by Bachelor's Degree
In terms of bachelor's degree, the demographic groups most similar to Immigrants from Lithuania are Immigrants from Kuwait (44.6%, a difference of 0.030%), Immigrants from Bulgaria (44.6%, a difference of 0.080%), Bolivian (44.6%, a difference of 0.12%), Estonian (44.6%, a difference of 0.12%), and Immigrants from Norway (44.5%, a difference of 0.25%).
| Demographics | Rating | Rank | Bachelor's Degree |
| Russians | 100.0 /100 | #37 | Exceptional 45.3% |
| Bulgarians | 100.0 /100 | #38 | Exceptional 45.3% |
| Immigrants | Latvia | 100.0 /100 | #39 | Exceptional 45.1% |
| Immigrants | Belarus | 100.0 /100 | #40 | Exceptional 45.0% |
| Immigrants | Malaysia | 100.0 /100 | #41 | Exceptional 45.0% |
| Immigrants | Saudi Arabia | 100.0 /100 | #42 | Exceptional 44.8% |
| Immigrants | South Africa | 99.9 /100 | #43 | Exceptional 44.8% |
| Immigrants | Lithuania | 99.9 /100 | #44 | Exceptional 44.6% |
| Immigrants | Kuwait | 99.9 /100 | #45 | Exceptional 44.6% |
| Immigrants | Bulgaria | 99.9 /100 | #46 | Exceptional 44.6% |
| Bolivians | 99.9 /100 | #47 | Exceptional 44.6% |
| Estonians | 99.9 /100 | #48 | Exceptional 44.6% |
| Immigrants | Norway | 99.9 /100 | #49 | Exceptional 44.5% |
| Immigrants | Greece | 99.9 /100 | #50 | Exceptional 44.5% |
| Asians | 99.9 /100 | #51 | Exceptional 44.4% |