Greek vs Immigrants from Lithuania Bachelor's Degree
COMPARE
Greek
Immigrants from Lithuania
Bachelor's Degree
Bachelor's Degree Comparison
Greeks
Immigrants from Lithuania
42.0%
BACHELOR'S DEGREE
99.0/ 100
METRIC RATING
89th/ 347
METRIC RANK
44.6%
BACHELOR'S DEGREE
99.9/ 100
METRIC RATING
44th/ 347
METRIC RANK
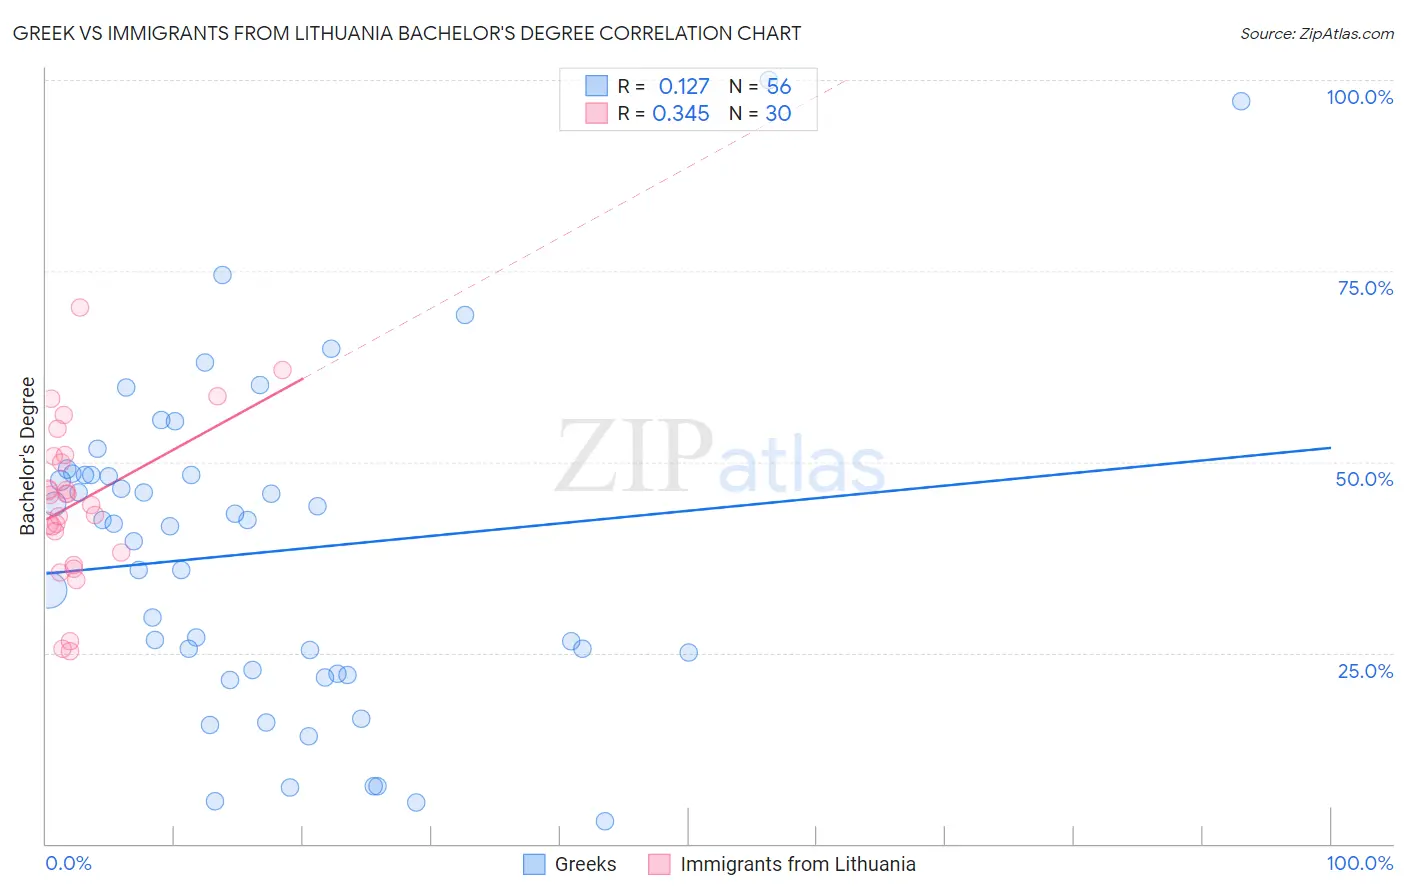
Greek vs Immigrants from Lithuania Bachelor's Degree Correlation Chart
The statistical analysis conducted on geographies consisting of 482,704,641 people shows a poor positive correlation between the proportion of Greeks and percentage of population with at least bachelor's degree education in the United States with a correlation coefficient (R) of 0.127 and weighted average of 42.0%. Similarly, the statistical analysis conducted on geographies consisting of 117,722,731 people shows a mild positive correlation between the proportion of Immigrants from Lithuania and percentage of population with at least bachelor's degree education in the United States with a correlation coefficient (R) of 0.345 and weighted average of 44.6%, a difference of 6.1%.
Bachelor's Degree Correlation Summary
| Measurement | Greek | Immigrants from Lithuania |
| Minimum | 2.9% | 25.2% |
| Maximum | 100.0% | 70.2% |
| Range | 97.1% | 45.0% |
| Mean | 38.2% | 44.7% |
| Median | 41.8% | 45.0% |
| Interquartile 25% (IQ1) | 22.6% | 38.1% |
| Interquartile 75% (IQ3) | 48.3% | 50.7% |
| Interquartile Range (IQR) | 25.8% | 12.6% |
| Standard Deviation (Sample) | 21.1% | 10.5% |
| Standard Deviation (Population) | 20.9% | 10.3% |
Similar Demographics by Bachelor's Degree
Demographics Similar to Greeks by Bachelor's Degree
In terms of bachelor's degree, the demographic groups most similar to Greeks are Immigrants from Western Europe (42.0%, a difference of 0.0%), Carpatho Rusyn (42.1%, a difference of 0.12%), Laotian (42.0%, a difference of 0.12%), Immigrants from Northern Africa (41.9%, a difference of 0.22%), and Maltese (41.9%, a difference of 0.30%).
| Demographics | Rating | Rank | Bachelor's Degree |
| Immigrants | Scotland | 99.2 /100 | #82 | Exceptional 42.3% |
| Armenians | 99.2 /100 | #83 | Exceptional 42.3% |
| Immigrants | Western Asia | 99.2 /100 | #84 | Exceptional 42.3% |
| Lithuanians | 99.2 /100 | #85 | Exceptional 42.2% |
| Immigrants | Brazil | 99.2 /100 | #86 | Exceptional 42.2% |
| Carpatho Rusyns | 99.0 /100 | #87 | Exceptional 42.1% |
| Immigrants | Western Europe | 99.0 /100 | #88 | Exceptional 42.0% |
| Greeks | 99.0 /100 | #89 | Exceptional 42.0% |
| Laotians | 98.9 /100 | #90 | Exceptional 42.0% |
| Immigrants | Northern Africa | 98.9 /100 | #91 | Exceptional 41.9% |
| Maltese | 98.8 /100 | #92 | Exceptional 41.9% |
| Immigrants | Canada | 98.6 /100 | #93 | Exceptional 41.7% |
| Immigrants | Nepal | 98.6 /100 | #94 | Exceptional 41.7% |
| Immigrants | North America | 98.5 /100 | #95 | Exceptional 41.7% |
| Immigrants | Moldova | 98.4 /100 | #96 | Exceptional 41.6% |
Demographics Similar to Immigrants from Lithuania by Bachelor's Degree
In terms of bachelor's degree, the demographic groups most similar to Immigrants from Lithuania are Immigrants from Kuwait (44.6%, a difference of 0.030%), Immigrants from Bulgaria (44.6%, a difference of 0.080%), Bolivian (44.6%, a difference of 0.12%), Estonian (44.6%, a difference of 0.12%), and Immigrants from Norway (44.5%, a difference of 0.25%).
| Demographics | Rating | Rank | Bachelor's Degree |
| Russians | 100.0 /100 | #37 | Exceptional 45.3% |
| Bulgarians | 100.0 /100 | #38 | Exceptional 45.3% |
| Immigrants | Latvia | 100.0 /100 | #39 | Exceptional 45.1% |
| Immigrants | Belarus | 100.0 /100 | #40 | Exceptional 45.0% |
| Immigrants | Malaysia | 100.0 /100 | #41 | Exceptional 45.0% |
| Immigrants | Saudi Arabia | 100.0 /100 | #42 | Exceptional 44.8% |
| Immigrants | South Africa | 99.9 /100 | #43 | Exceptional 44.8% |
| Immigrants | Lithuania | 99.9 /100 | #44 | Exceptional 44.6% |
| Immigrants | Kuwait | 99.9 /100 | #45 | Exceptional 44.6% |
| Immigrants | Bulgaria | 99.9 /100 | #46 | Exceptional 44.6% |
| Bolivians | 99.9 /100 | #47 | Exceptional 44.6% |
| Estonians | 99.9 /100 | #48 | Exceptional 44.6% |
| Immigrants | Norway | 99.9 /100 | #49 | Exceptional 44.5% |
| Immigrants | Greece | 99.9 /100 | #50 | Exceptional 44.5% |
| Asians | 99.9 /100 | #51 | Exceptional 44.4% |