Aleut vs Immigrants from Lithuania Bachelor's Degree
COMPARE
Aleut
Immigrants from Lithuania
Bachelor's Degree
Bachelor's Degree Comparison
Aleuts
Immigrants from Lithuania
31.3%
BACHELOR'S DEGREE
0.1/ 100
METRIC RATING
285th/ 347
METRIC RANK
44.6%
BACHELOR'S DEGREE
99.9/ 100
METRIC RATING
44th/ 347
METRIC RANK
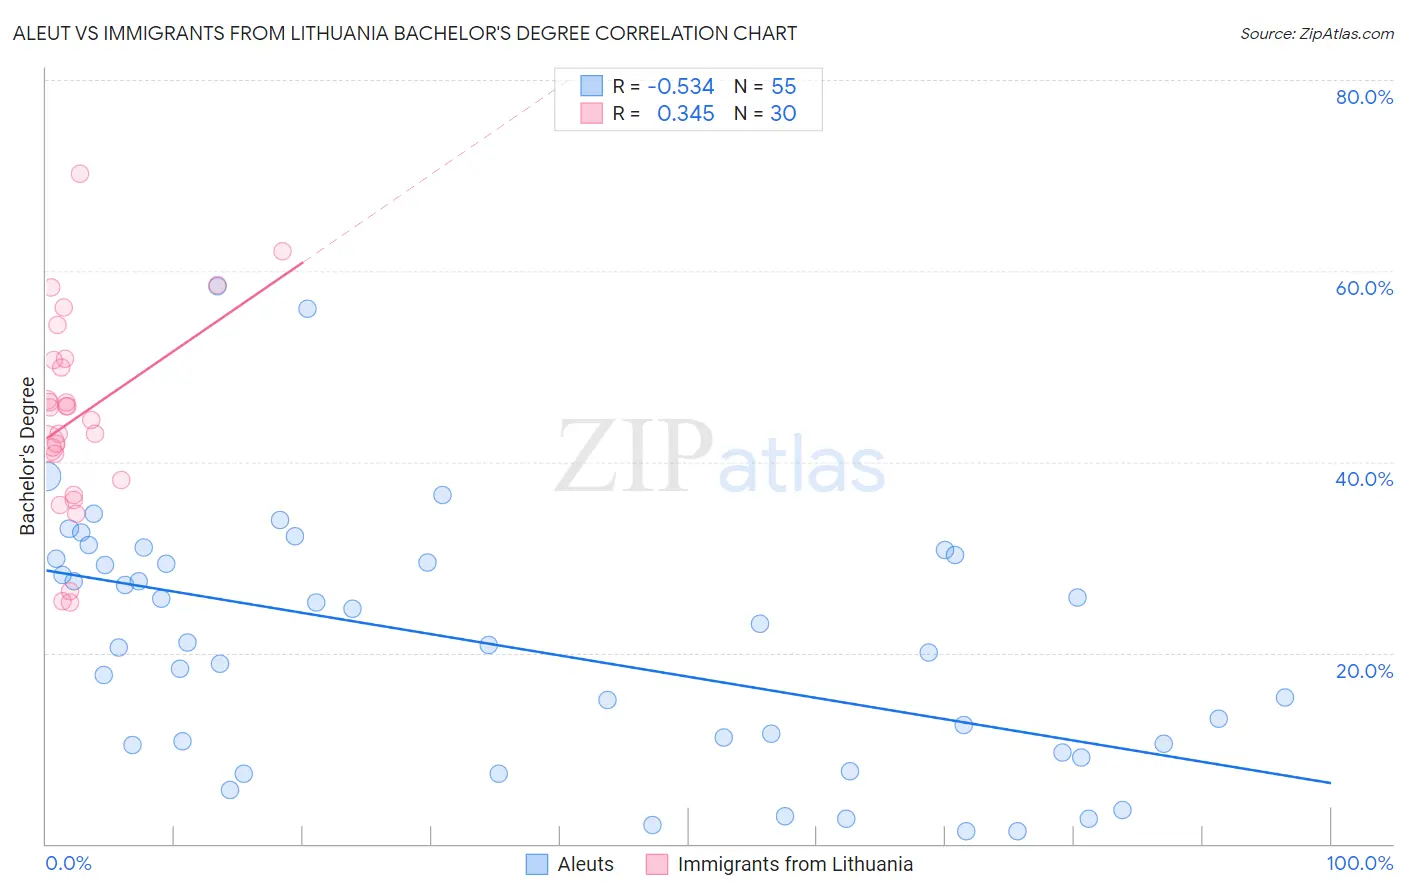
Aleut vs Immigrants from Lithuania Bachelor's Degree Correlation Chart
The statistical analysis conducted on geographies consisting of 61,782,473 people shows a substantial negative correlation between the proportion of Aleuts and percentage of population with at least bachelor's degree education in the United States with a correlation coefficient (R) of -0.534 and weighted average of 31.3%. Similarly, the statistical analysis conducted on geographies consisting of 117,722,731 people shows a mild positive correlation between the proportion of Immigrants from Lithuania and percentage of population with at least bachelor's degree education in the United States with a correlation coefficient (R) of 0.345 and weighted average of 44.6%, a difference of 42.4%.
Bachelor's Degree Correlation Summary
| Measurement | Aleut | Immigrants from Lithuania |
| Minimum | 1.3% | 25.2% |
| Maximum | 58.3% | 70.2% |
| Range | 57.1% | 45.0% |
| Mean | 20.8% | 44.7% |
| Median | 20.9% | 45.0% |
| Interquartile 25% (IQ1) | 10.3% | 38.1% |
| Interquartile 75% (IQ3) | 29.9% | 50.7% |
| Interquartile Range (IQR) | 19.5% | 12.6% |
| Standard Deviation (Sample) | 13.0% | 10.5% |
| Standard Deviation (Population) | 12.9% | 10.3% |
Similar Demographics by Bachelor's Degree
Demographics Similar to Aleuts by Bachelor's Degree
In terms of bachelor's degree, the demographic groups most similar to Aleuts are Haitian (31.3%, a difference of 0.010%), Honduran (31.3%, a difference of 0.040%), Immigrants from El Salvador (31.3%, a difference of 0.050%), Immigrants from Caribbean (31.4%, a difference of 0.32%), and Blackfeet (31.5%, a difference of 0.47%).
| Demographics | Rating | Rank | Bachelor's Degree |
| Marshallese | 0.1 /100 | #278 | Tragic 31.7% |
| Hawaiians | 0.1 /100 | #279 | Tragic 31.6% |
| Immigrants | Laos | 0.1 /100 | #280 | Tragic 31.6% |
| Blackfeet | 0.1 /100 | #281 | Tragic 31.5% |
| Immigrants | Caribbean | 0.1 /100 | #282 | Tragic 31.4% |
| Hondurans | 0.1 /100 | #283 | Tragic 31.3% |
| Haitians | 0.1 /100 | #284 | Tragic 31.3% |
| Aleuts | 0.1 /100 | #285 | Tragic 31.3% |
| Immigrants | El Salvador | 0.1 /100 | #286 | Tragic 31.3% |
| Ottawa | 0.1 /100 | #287 | Tragic 31.1% |
| Guatemalans | 0.1 /100 | #288 | Tragic 31.0% |
| Puerto Ricans | 0.1 /100 | #289 | Tragic 31.0% |
| Immigrants | Honduras | 0.1 /100 | #290 | Tragic 30.9% |
| Blacks/African Americans | 0.1 /100 | #291 | Tragic 30.9% |
| Ute | 0.1 /100 | #292 | Tragic 30.9% |
Demographics Similar to Immigrants from Lithuania by Bachelor's Degree
In terms of bachelor's degree, the demographic groups most similar to Immigrants from Lithuania are Immigrants from Kuwait (44.6%, a difference of 0.030%), Immigrants from Bulgaria (44.6%, a difference of 0.080%), Bolivian (44.6%, a difference of 0.12%), Estonian (44.6%, a difference of 0.12%), and Immigrants from Norway (44.5%, a difference of 0.25%).
| Demographics | Rating | Rank | Bachelor's Degree |
| Russians | 100.0 /100 | #37 | Exceptional 45.3% |
| Bulgarians | 100.0 /100 | #38 | Exceptional 45.3% |
| Immigrants | Latvia | 100.0 /100 | #39 | Exceptional 45.1% |
| Immigrants | Belarus | 100.0 /100 | #40 | Exceptional 45.0% |
| Immigrants | Malaysia | 100.0 /100 | #41 | Exceptional 45.0% |
| Immigrants | Saudi Arabia | 100.0 /100 | #42 | Exceptional 44.8% |
| Immigrants | South Africa | 99.9 /100 | #43 | Exceptional 44.8% |
| Immigrants | Lithuania | 99.9 /100 | #44 | Exceptional 44.6% |
| Immigrants | Kuwait | 99.9 /100 | #45 | Exceptional 44.6% |
| Immigrants | Bulgaria | 99.9 /100 | #46 | Exceptional 44.6% |
| Bolivians | 99.9 /100 | #47 | Exceptional 44.6% |
| Estonians | 99.9 /100 | #48 | Exceptional 44.6% |
| Immigrants | Norway | 99.9 /100 | #49 | Exceptional 44.5% |
| Immigrants | Greece | 99.9 /100 | #50 | Exceptional 44.5% |
| Asians | 99.9 /100 | #51 | Exceptional 44.4% |