Austrian vs Immigrants from China 10th Grade
COMPARE
Austrian
Immigrants from China
10th Grade
10th Grade Comparison
Austrians
Immigrants from China
95.1%
10TH GRADE
99.8/ 100
METRIC RATING
51st/ 347
METRIC RANK
93.2%
10TH GRADE
5.9/ 100
METRIC RATING
228th/ 347
METRIC RANK
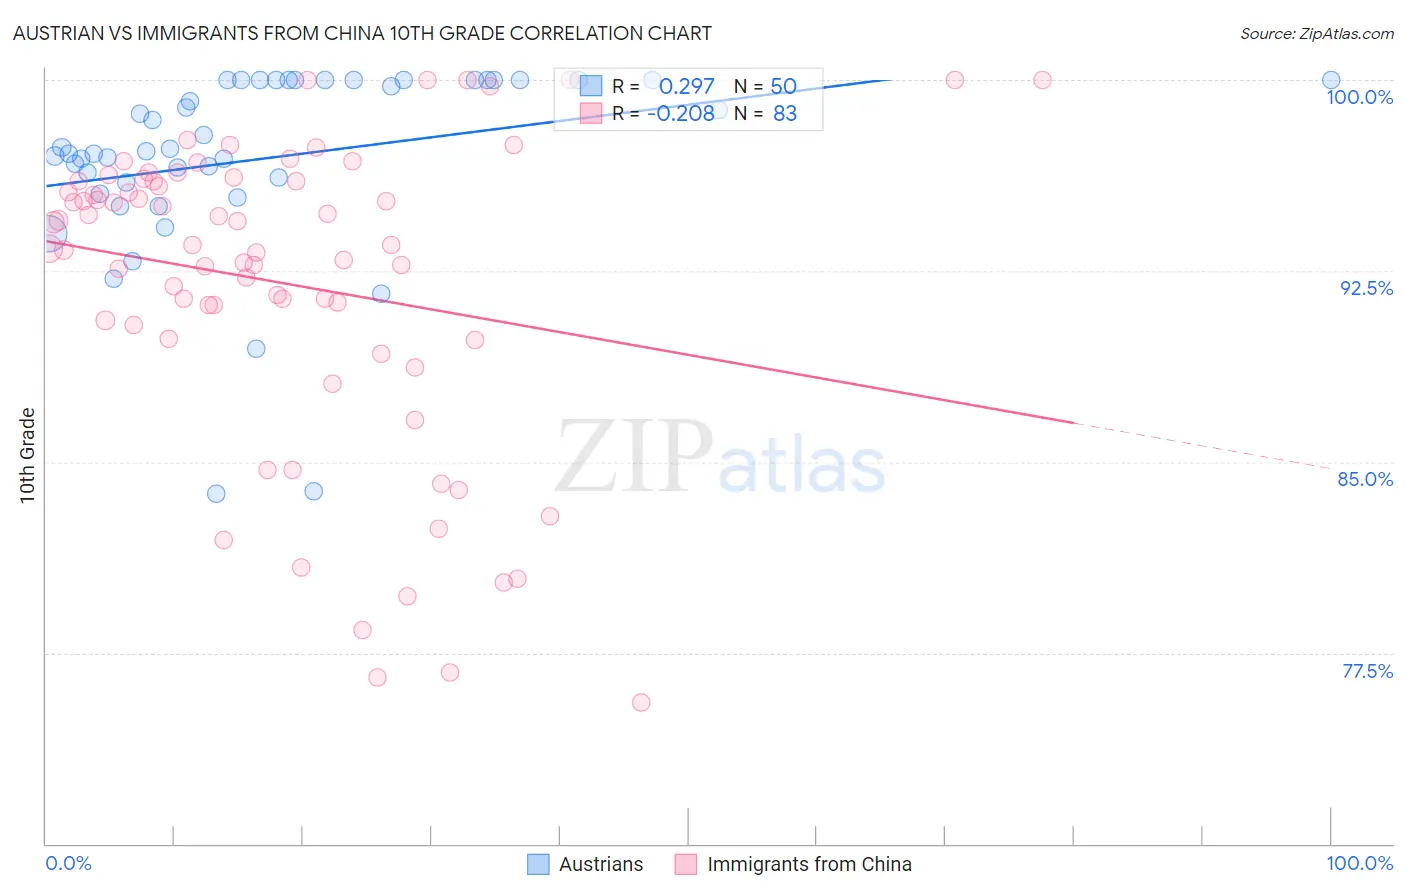
Austrian vs Immigrants from China 10th Grade Correlation Chart
The statistical analysis conducted on geographies consisting of 452,082,820 people shows a weak positive correlation between the proportion of Austrians and percentage of population with at least 10th grade education in the United States with a correlation coefficient (R) of 0.297 and weighted average of 95.1%. Similarly, the statistical analysis conducted on geographies consisting of 457,082,957 people shows a weak negative correlation between the proportion of Immigrants from China and percentage of population with at least 10th grade education in the United States with a correlation coefficient (R) of -0.208 and weighted average of 93.2%, a difference of 2.1%.
10th Grade Correlation Summary
| Measurement | Austrian | Immigrants from China |
| Minimum | 83.8% | 75.5% |
| Maximum | 100.0% | 100.0% |
| Range | 16.2% | 24.5% |
| Mean | 96.9% | 92.0% |
| Median | 97.3% | 93.5% |
| Interquartile 25% (IQ1) | 96.0% | 89.9% |
| Interquartile 75% (IQ3) | 100.0% | 96.0% |
| Interquartile Range (IQR) | 4.0% | 6.2% |
| Standard Deviation (Sample) | 3.7% | 6.1% |
| Standard Deviation (Population) | 3.7% | 6.1% |
Similar Demographics by 10th Grade
Demographics Similar to Austrians by 10th Grade
In terms of 10th grade, the demographic groups most similar to Austrians are Ottawa (95.1%, a difference of 0.0%), Immigrants from Canada (95.1%, a difference of 0.010%), Immigrants from North America (95.0%, a difference of 0.010%), Immigrants from Austria (95.1%, a difference of 0.030%), and Immigrants from Lithuania (95.0%, a difference of 0.030%).
| Demographics | Rating | Rank | 10th Grade |
| Immigrants | Northern Europe | 99.9 /100 | #44 | Exceptional 95.2% |
| Greeks | 99.9 /100 | #45 | Exceptional 95.2% |
| Czechoslovakians | 99.9 /100 | #46 | Exceptional 95.1% |
| Serbians | 99.9 /100 | #47 | Exceptional 95.1% |
| Australians | 99.9 /100 | #48 | Exceptional 95.1% |
| Immigrants | Austria | 99.9 /100 | #49 | Exceptional 95.1% |
| Immigrants | Canada | 99.8 /100 | #50 | Exceptional 95.1% |
| Austrians | 99.8 /100 | #51 | Exceptional 95.1% |
| Ottawa | 99.8 /100 | #52 | Exceptional 95.1% |
| Immigrants | North America | 99.8 /100 | #53 | Exceptional 95.0% |
| Immigrants | Lithuania | 99.8 /100 | #54 | Exceptional 95.0% |
| Immigrants | Ireland | 99.8 /100 | #55 | Exceptional 95.0% |
| New Zealanders | 99.8 /100 | #56 | Exceptional 95.0% |
| Ukrainians | 99.8 /100 | #57 | Exceptional 95.0% |
| Aleuts | 99.8 /100 | #58 | Exceptional 95.0% |
Demographics Similar to Immigrants from China by 10th Grade
In terms of 10th grade, the demographic groups most similar to Immigrants from China are Somali (93.2%, a difference of 0.010%), Korean (93.2%, a difference of 0.010%), Black/African American (93.2%, a difference of 0.010%), Bolivian (93.2%, a difference of 0.030%), and Immigrants from Ethiopia (93.1%, a difference of 0.030%).
| Demographics | Rating | Rank | 10th Grade |
| Immigrants | Southern Europe | 8.9 /100 | #221 | Tragic 93.2% |
| Ethiopians | 7.9 /100 | #222 | Tragic 93.2% |
| Immigrants | Sierra Leone | 7.6 /100 | #223 | Tragic 93.2% |
| Bolivians | 6.7 /100 | #224 | Tragic 93.2% |
| Somalis | 6.2 /100 | #225 | Tragic 93.2% |
| Koreans | 6.1 /100 | #226 | Tragic 93.2% |
| Blacks/African Americans | 6.0 /100 | #227 | Tragic 93.2% |
| Immigrants | China | 5.9 /100 | #228 | Tragic 93.2% |
| Immigrants | Ethiopia | 5.1 /100 | #229 | Tragic 93.1% |
| Immigrants | Africa | 5.0 /100 | #230 | Tragic 93.1% |
| South American Indians | 4.9 /100 | #231 | Tragic 93.1% |
| Bahamians | 4.9 /100 | #232 | Tragic 93.1% |
| Comanche | 4.9 /100 | #233 | Tragic 93.1% |
| Sub-Saharan Africans | 4.7 /100 | #234 | Tragic 93.1% |
| Africans | 4.6 /100 | #235 | Tragic 93.1% |