Immigrants from Albania vs Immigrants from China Associate's Degree
COMPARE
Immigrants from Albania
Immigrants from China
Associate's Degree
Associate's Degree Comparison
Immigrants from Albania
Immigrants from China
48.2%
ASSOCIATE'S DEGREE
89.9/ 100
METRIC RATING
132nd/ 347
METRIC RANK
55.5%
ASSOCIATE'S DEGREE
100.0/ 100
METRIC RATING
13th/ 347
METRIC RANK
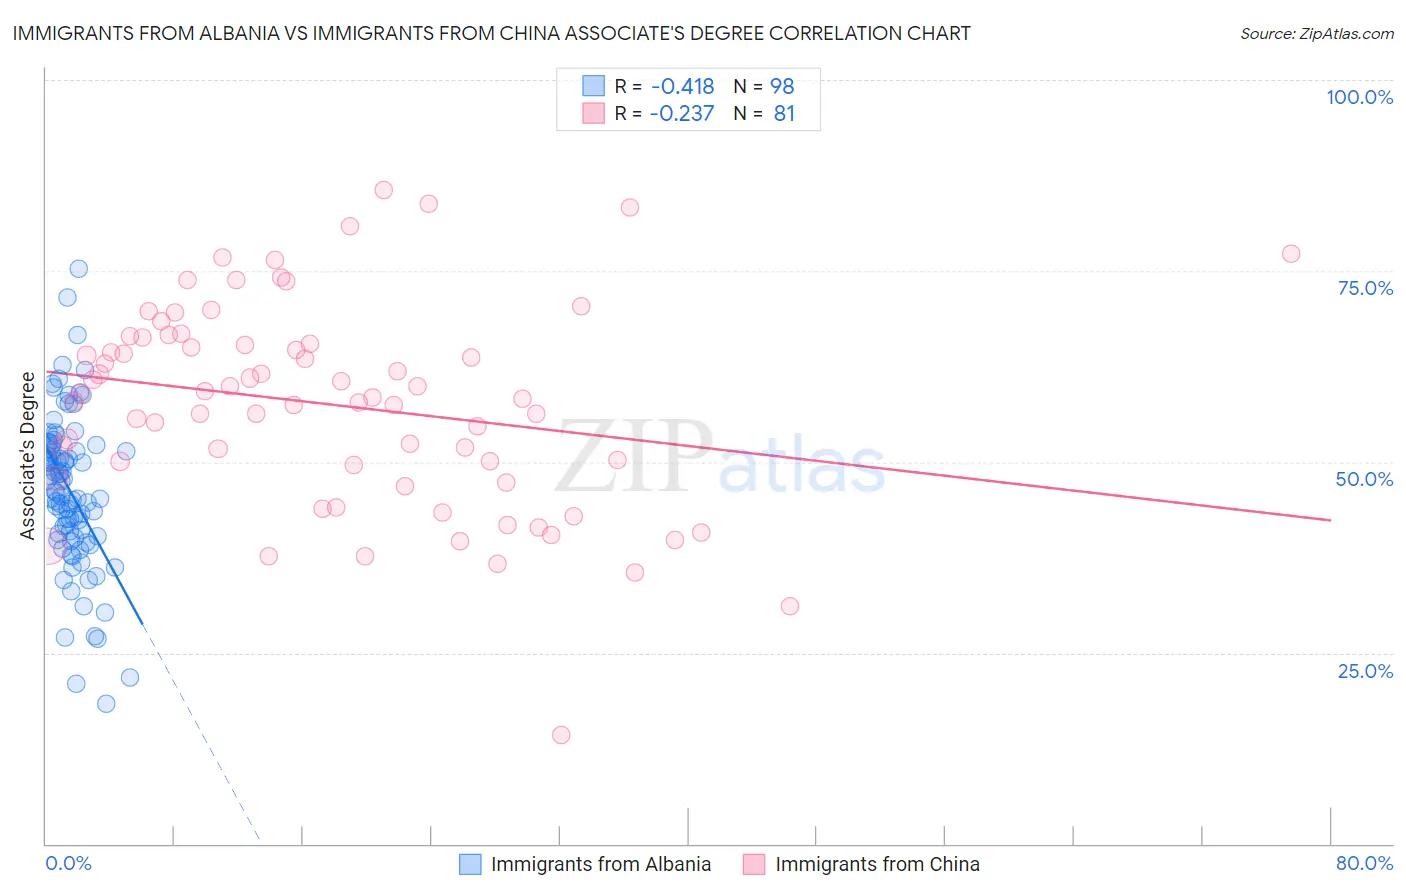
Immigrants from Albania vs Immigrants from China Associate's Degree Correlation Chart
The statistical analysis conducted on geographies consisting of 119,391,185 people shows a moderate negative correlation between the proportion of Immigrants from Albania and percentage of population with at least associate's degree education in the United States with a correlation coefficient (R) of -0.418 and weighted average of 48.2%. Similarly, the statistical analysis conducted on geographies consisting of 457,025,047 people shows a weak negative correlation between the proportion of Immigrants from China and percentage of population with at least associate's degree education in the United States with a correlation coefficient (R) of -0.237 and weighted average of 55.5%, a difference of 15.0%.
Associate's Degree Correlation Summary
| Measurement | Immigrants from Albania | Immigrants from China |
| Minimum | 18.3% | 14.2% |
| Maximum | 75.3% | 85.6% |
| Range | 57.0% | 71.4% |
| Mean | 46.2% | 57.5% |
| Median | 46.0% | 58.5% |
| Interquartile 25% (IQ1) | 40.3% | 48.7% |
| Interquartile 75% (IQ3) | 52.0% | 65.9% |
| Interquartile Range (IQR) | 11.7% | 17.2% |
| Standard Deviation (Sample) | 10.1% | 13.4% |
| Standard Deviation (Population) | 10.1% | 13.3% |
Similar Demographics by Associate's Degree
Demographics Similar to Immigrants from Albania by Associate's Degree
In terms of associate's degree, the demographic groups most similar to Immigrants from Albania are Assyrian/Chaldean/Syriac (48.2%, a difference of 0.080%), Moroccan (48.2%, a difference of 0.10%), European (48.2%, a difference of 0.16%), Icelander (48.3%, a difference of 0.18%), and Immigrants from Jordan (48.4%, a difference of 0.29%).
| Demographics | Rating | Rank | Associate's Degree |
| Chinese | 92.5 /100 | #125 | Exceptional 48.5% |
| Immigrants | Syria | 92.2 /100 | #126 | Exceptional 48.5% |
| Immigrants | Uganda | 92.1 /100 | #127 | Exceptional 48.5% |
| Immigrants | Eastern Africa | 91.6 /100 | #128 | Exceptional 48.4% |
| Swedes | 91.5 /100 | #129 | Exceptional 48.4% |
| Immigrants | Jordan | 91.2 /100 | #130 | Exceptional 48.4% |
| Icelanders | 90.8 /100 | #131 | Exceptional 48.3% |
| Immigrants | Albania | 89.9 /100 | #132 | Excellent 48.2% |
| Assyrians/Chaldeans/Syriacs | 89.4 /100 | #133 | Excellent 48.2% |
| Moroccans | 89.3 /100 | #134 | Excellent 48.2% |
| Europeans | 89.0 /100 | #135 | Excellent 48.2% |
| Pakistanis | 88.0 /100 | #136 | Excellent 48.1% |
| Immigrants | Eritrea | 87.8 /100 | #137 | Excellent 48.1% |
| Poles | 87.3 /100 | #138 | Excellent 48.0% |
| Slovenes | 85.1 /100 | #139 | Excellent 47.9% |
Demographics Similar to Immigrants from China by Associate's Degree
In terms of associate's degree, the demographic groups most similar to Immigrants from China are Immigrants from Hong Kong (55.4%, a difference of 0.14%), Immigrants from Eastern Asia (55.4%, a difference of 0.17%), Immigrants from South Central Asia (55.7%, a difference of 0.49%), Immigrants from Australia (55.8%, a difference of 0.61%), and Soviet Union (55.1%, a difference of 0.65%).
| Demographics | Rating | Rank | Associate's Degree |
| Okinawans | 100.0 /100 | #6 | Exceptional 57.7% |
| Immigrants | Iran | 100.0 /100 | #7 | Exceptional 57.7% |
| Thais | 100.0 /100 | #8 | Exceptional 57.4% |
| Immigrants | Israel | 100.0 /100 | #9 | Exceptional 56.8% |
| Cypriots | 100.0 /100 | #10 | Exceptional 56.4% |
| Immigrants | Australia | 100.0 /100 | #11 | Exceptional 55.8% |
| Immigrants | South Central Asia | 100.0 /100 | #12 | Exceptional 55.7% |
| Immigrants | China | 100.0 /100 | #13 | Exceptional 55.5% |
| Immigrants | Hong Kong | 100.0 /100 | #14 | Exceptional 55.4% |
| Immigrants | Eastern Asia | 100.0 /100 | #15 | Exceptional 55.4% |
| Soviet Union | 100.0 /100 | #16 | Exceptional 55.1% |
| Eastern Europeans | 100.0 /100 | #17 | Exceptional 55.0% |
| Indians (Asian) | 100.0 /100 | #18 | Exceptional 54.8% |
| Immigrants | Ireland | 100.0 /100 | #19 | Exceptional 54.7% |
| Cambodians | 100.0 /100 | #20 | Exceptional 54.6% |