Austrian vs Immigrants from China Unemployment Among Ages 45 to 54 years
COMPARE
Austrian
Immigrants from China
Unemployment Among Ages 45 to 54 years
Unemployment Among Ages 45 to 54 years Comparison
Austrians
Immigrants from China
4.3%
UNEMPLOYMENT AMONG AGES 45 TO 54 YEARS
99.0/ 100
METRIC RATING
64th/ 347
METRIC RANK
4.5%
UNEMPLOYMENT AMONG AGES 45 TO 54 YEARS
46.7/ 100
METRIC RATING
182nd/ 347
METRIC RANK
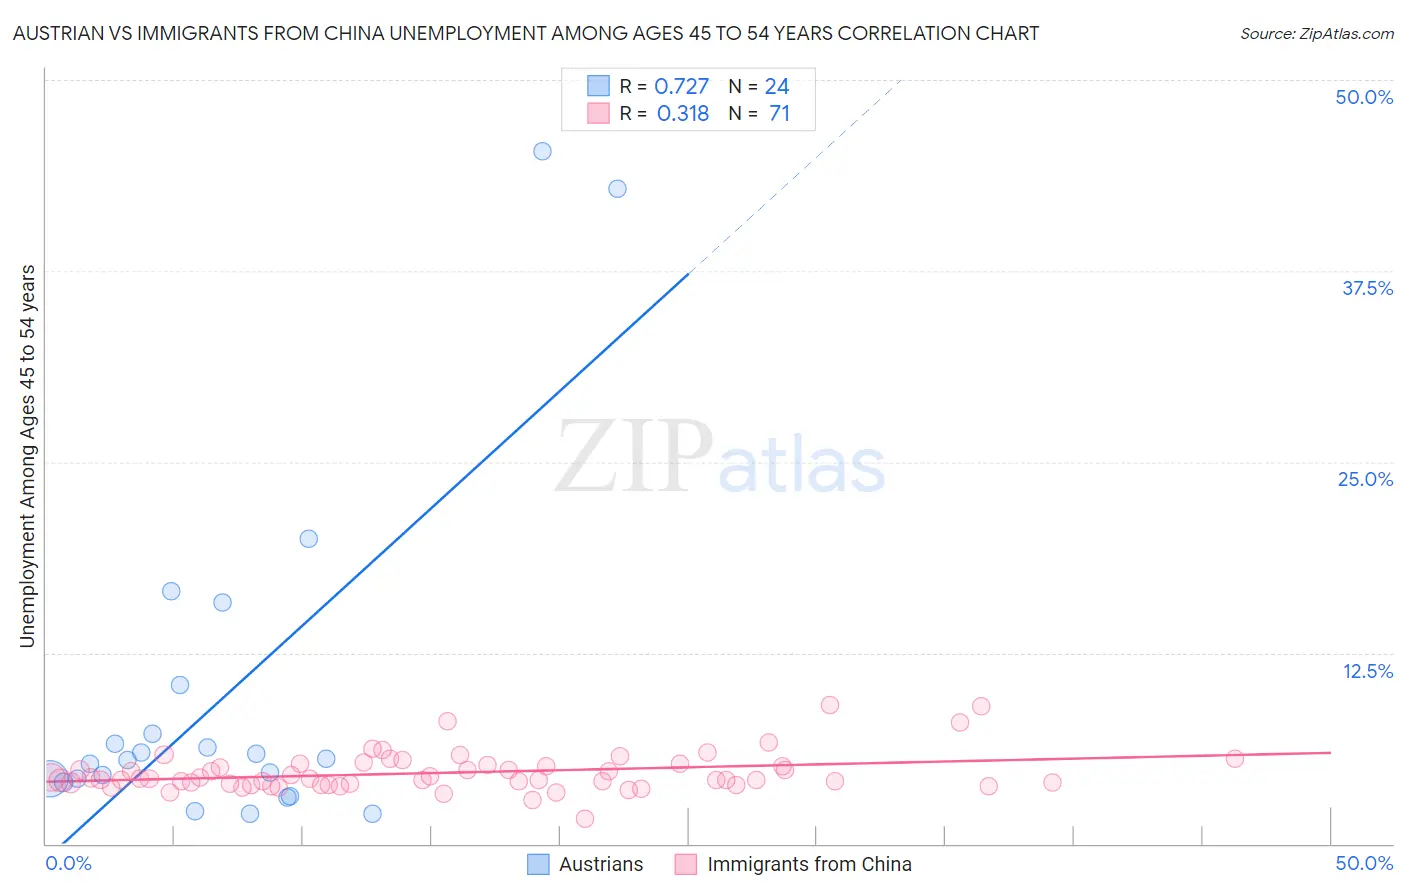
Austrian vs Immigrants from China Unemployment Among Ages 45 to 54 years Correlation Chart
The statistical analysis conducted on geographies consisting of 434,363,513 people shows a strong positive correlation between the proportion of Austrians and unemployment rate among population between the ages 45 and 54 in the United States with a correlation coefficient (R) of 0.727 and weighted average of 4.3%. Similarly, the statistical analysis conducted on geographies consisting of 442,180,379 people shows a mild positive correlation between the proportion of Immigrants from China and unemployment rate among population between the ages 45 and 54 in the United States with a correlation coefficient (R) of 0.318 and weighted average of 4.5%, a difference of 5.8%.
Unemployment Among Ages 45 to 54 years Correlation Summary
| Measurement | Austrian | Immigrants from China |
| Minimum | 1.9% | 1.6% |
| Maximum | 45.3% | 9.1% |
| Range | 43.4% | 7.5% |
| Mean | 9.7% | 4.6% |
| Median | 5.6% | 4.2% |
| Interquartile 25% (IQ1) | 4.1% | 3.9% |
| Interquartile 75% (IQ3) | 8.8% | 5.2% |
| Interquartile Range (IQR) | 4.6% | 1.3% |
| Standard Deviation (Sample) | 11.6% | 1.3% |
| Standard Deviation (Population) | 11.3% | 1.3% |
Similar Demographics by Unemployment Among Ages 45 to 54 years
Demographics Similar to Austrians by Unemployment Among Ages 45 to 54 years
In terms of unemployment among ages 45 to 54 years, the demographic groups most similar to Austrians are Immigrants from Sudan (4.3%, a difference of 0.030%), Turkish (4.3%, a difference of 0.070%), Immigrants from Nepal (4.3%, a difference of 0.090%), Pennsylvania German (4.3%, a difference of 0.10%), and Slovak (4.3%, a difference of 0.17%).
| Demographics | Rating | Rank | Unemployment Among Ages 45 to 54 years |
| Immigrants | Sri Lanka | 99.3 /100 | #57 | Exceptional 4.3% |
| Greeks | 99.3 /100 | #58 | Exceptional 4.3% |
| Okinawans | 99.2 /100 | #59 | Exceptional 4.3% |
| Immigrants | Korea | 99.2 /100 | #60 | Exceptional 4.3% |
| Immigrants | Pakistan | 99.2 /100 | #61 | Exceptional 4.3% |
| Lithuanians | 99.1 /100 | #62 | Exceptional 4.3% |
| Pennsylvania Germans | 99.1 /100 | #63 | Exceptional 4.3% |
| Austrians | 99.0 /100 | #64 | Exceptional 4.3% |
| Immigrants | Sudan | 99.0 /100 | #65 | Exceptional 4.3% |
| Turks | 98.9 /100 | #66 | Exceptional 4.3% |
| Immigrants | Nepal | 98.9 /100 | #67 | Exceptional 4.3% |
| Slovaks | 98.8 /100 | #68 | Exceptional 4.3% |
| Immigrants | Japan | 98.7 /100 | #69 | Exceptional 4.3% |
| Paraguayans | 98.6 /100 | #70 | Exceptional 4.3% |
| Palestinians | 98.5 /100 | #71 | Exceptional 4.3% |
Demographics Similar to Immigrants from China by Unemployment Among Ages 45 to 54 years
In terms of unemployment among ages 45 to 54 years, the demographic groups most similar to Immigrants from China are Sierra Leonean (4.5%, a difference of 0.0%), Immigrants from Poland (4.5%, a difference of 0.010%), Malaysian (4.5%, a difference of 0.030%), Immigrants from Hong Kong (4.5%, a difference of 0.040%), and Immigrants from Russia (4.5%, a difference of 0.070%).
| Demographics | Rating | Rank | Unemployment Among Ages 45 to 54 years |
| Immigrants | France | 49.4 /100 | #175 | Average 4.5% |
| Puget Sound Salish | 49.1 /100 | #176 | Average 4.5% |
| Immigrants | Northern Africa | 49.0 /100 | #177 | Average 4.5% |
| Immigrants | Australia | 48.5 /100 | #178 | Average 4.5% |
| Immigrants | Russia | 48.2 /100 | #179 | Average 4.5% |
| Malaysians | 47.5 /100 | #180 | Average 4.5% |
| Immigrants | Poland | 47.0 /100 | #181 | Average 4.5% |
| Immigrants | China | 46.7 /100 | #182 | Average 4.5% |
| Sierra Leoneans | 46.7 /100 | #183 | Average 4.5% |
| Immigrants | Hong Kong | 45.9 /100 | #184 | Average 4.5% |
| Immigrants | Philippines | 41.0 /100 | #185 | Average 4.5% |
| Hawaiians | 39.1 /100 | #186 | Fair 4.5% |
| Immigrants | Ukraine | 36.8 /100 | #187 | Fair 4.5% |
| Immigrants | Sierra Leone | 36.3 /100 | #188 | Fair 4.6% |
| Immigrants | Laos | 35.7 /100 | #189 | Fair 4.6% |