Navajo vs Ecuadorian Associate's Degree
COMPARE
Navajo
Ecuadorian
Associate's Degree
Associate's Degree Comparison
Navajo
Ecuadorians
32.6%
ASSOCIATE'S DEGREE
0.0/ 100
METRIC RATING
340th/ 347
METRIC RANK
43.0%
ASSOCIATE'S DEGREE
2.0/ 100
METRIC RATING
235th/ 347
METRIC RANK
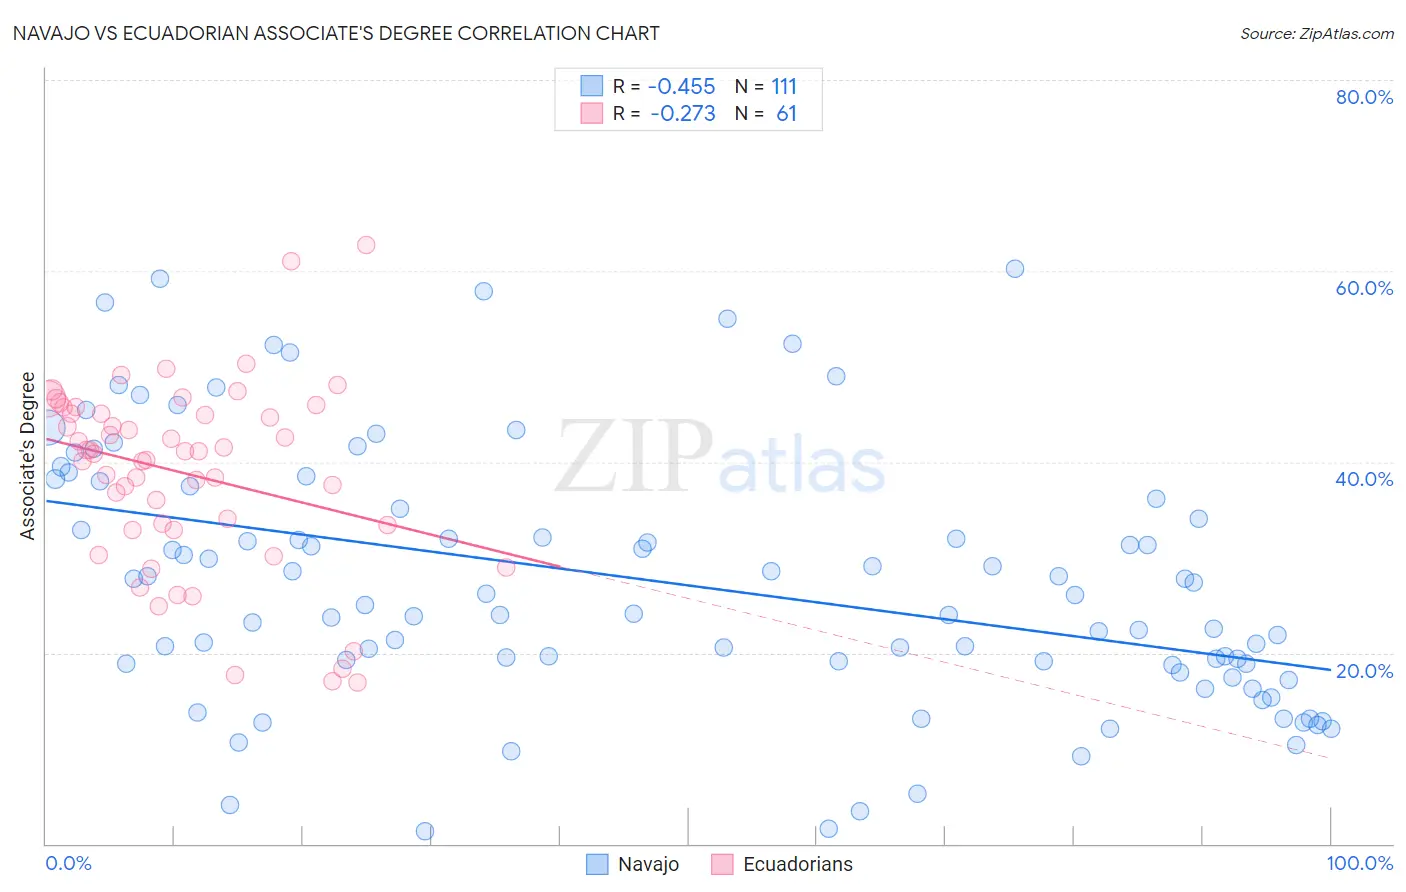
Navajo vs Ecuadorian Associate's Degree Correlation Chart
The statistical analysis conducted on geographies consisting of 224,870,654 people shows a moderate negative correlation between the proportion of Navajo and percentage of population with at least associate's degree education in the United States with a correlation coefficient (R) of -0.455 and weighted average of 32.6%. Similarly, the statistical analysis conducted on geographies consisting of 317,844,783 people shows a weak negative correlation between the proportion of Ecuadorians and percentage of population with at least associate's degree education in the United States with a correlation coefficient (R) of -0.273 and weighted average of 43.0%, a difference of 31.9%.
Associate's Degree Correlation Summary
| Measurement | Navajo | Ecuadorian |
| Minimum | 1.3% | 16.9% |
| Maximum | 60.2% | 62.8% |
| Range | 58.9% | 45.8% |
| Mean | 27.4% | 38.8% |
| Median | 25.1% | 41.1% |
| Interquartile 25% (IQ1) | 18.8% | 33.1% |
| Interquartile 75% (IQ3) | 36.2% | 45.4% |
| Interquartile Range (IQR) | 17.4% | 12.3% |
| Standard Deviation (Sample) | 13.5% | 9.7% |
| Standard Deviation (Population) | 13.4% | 9.7% |
Similar Demographics by Associate's Degree
Demographics Similar to Navajo by Associate's Degree
In terms of associate's degree, the demographic groups most similar to Navajo are Inupiat (32.6%, a difference of 0.050%), Yakama (32.3%, a difference of 0.83%), Tohono O'odham (31.8%, a difference of 2.5%), Immigrants from Mexico (33.7%, a difference of 3.5%), and Pueblo (34.0%, a difference of 4.3%).
| Demographics | Rating | Rank | Associate's Degree |
| Mexicans | 0.0 /100 | #333 | Tragic 35.0% |
| Natives/Alaskans | 0.0 /100 | #334 | Tragic 34.9% |
| Spanish American Indians | 0.0 /100 | #335 | Tragic 34.9% |
| Hopi | 0.0 /100 | #336 | Tragic 34.6% |
| Lumbee | 0.0 /100 | #337 | Tragic 34.1% |
| Pueblo | 0.0 /100 | #338 | Tragic 34.0% |
| Immigrants | Mexico | 0.0 /100 | #339 | Tragic 33.7% |
| Navajo | 0.0 /100 | #340 | Tragic 32.6% |
| Inupiat | 0.0 /100 | #341 | Tragic 32.6% |
| Yakama | 0.0 /100 | #342 | Tragic 32.3% |
| Tohono O'odham | 0.0 /100 | #343 | Tragic 31.8% |
| Yuman | 0.0 /100 | #344 | Tragic 31.3% |
| Pima | 0.0 /100 | #345 | Tragic 30.2% |
| Houma | 0.0 /100 | #346 | Tragic 28.2% |
| Yup'ik | 0.0 /100 | #347 | Tragic 25.0% |
Demographics Similar to Ecuadorians by Associate's Degree
In terms of associate's degree, the demographic groups most similar to Ecuadorians are Immigrants from St. Vincent and the Grenadines (42.9%, a difference of 0.080%), Tlingit-Haida (43.0%, a difference of 0.090%), Nonimmigrants (42.9%, a difference of 0.10%), Tongan (43.0%, a difference of 0.19%), and Native Hawaiian (43.1%, a difference of 0.35%).
| Demographics | Rating | Rank | Associate's Degree |
| Hmong | 3.2 /100 | #228 | Tragic 43.4% |
| Immigrants | Trinidad and Tobago | 3.0 /100 | #229 | Tragic 43.3% |
| Immigrants | Barbados | 2.9 /100 | #230 | Tragic 43.3% |
| Liberians | 2.9 /100 | #231 | Tragic 43.3% |
| Native Hawaiians | 2.3 /100 | #232 | Tragic 43.1% |
| Tongans | 2.2 /100 | #233 | Tragic 43.0% |
| Tlingit-Haida | 2.1 /100 | #234 | Tragic 43.0% |
| Ecuadorians | 2.0 /100 | #235 | Tragic 43.0% |
| Immigrants | St. Vincent and the Grenadines | 1.9 /100 | #236 | Tragic 42.9% |
| Immigrants | Nonimmigrants | 1.9 /100 | #237 | Tragic 42.9% |
| Iroquois | 1.7 /100 | #238 | Tragic 42.8% |
| Immigrants | Grenada | 1.3 /100 | #239 | Tragic 42.6% |
| Cree | 1.2 /100 | #240 | Tragic 42.5% |
| British West Indians | 1.0 /100 | #241 | Tragic 42.4% |
| Immigrants | West Indies | 1.0 /100 | #242 | Tragic 42.4% |