Spanish American vs Ecuadorian Associate's Degree
COMPARE
Spanish American
Ecuadorian
Associate's Degree
Associate's Degree Comparison
Spanish Americans
Ecuadorians
41.8%
ASSOCIATE'S DEGREE
0.5/ 100
METRIC RATING
257th/ 347
METRIC RANK
43.0%
ASSOCIATE'S DEGREE
2.0/ 100
METRIC RATING
235th/ 347
METRIC RANK
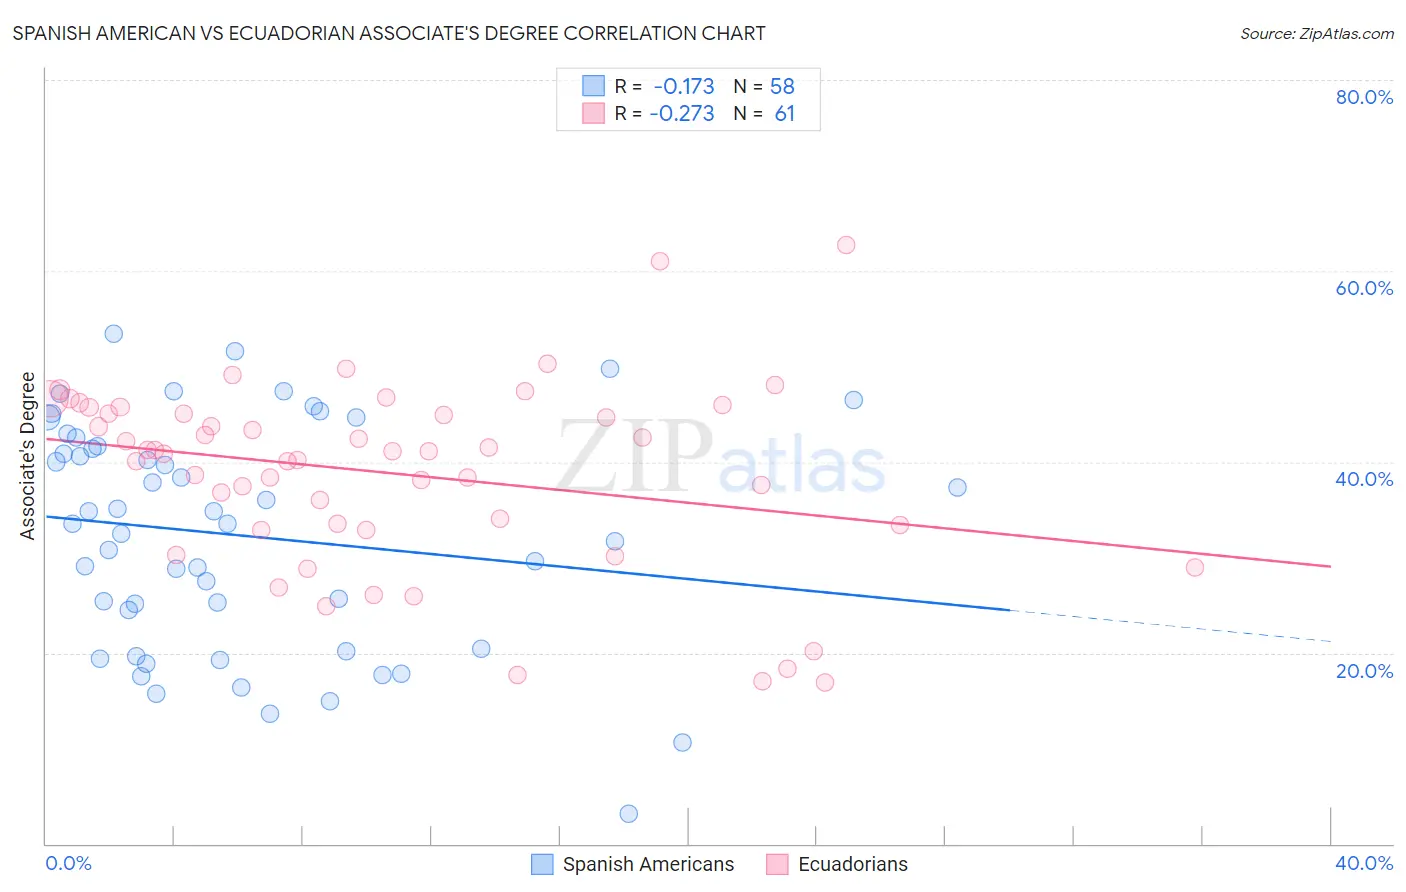
Spanish American vs Ecuadorian Associate's Degree Correlation Chart
The statistical analysis conducted on geographies consisting of 103,167,704 people shows a poor negative correlation between the proportion of Spanish Americans and percentage of population with at least associate's degree education in the United States with a correlation coefficient (R) of -0.173 and weighted average of 41.8%. Similarly, the statistical analysis conducted on geographies consisting of 317,844,783 people shows a weak negative correlation between the proportion of Ecuadorians and percentage of population with at least associate's degree education in the United States with a correlation coefficient (R) of -0.273 and weighted average of 43.0%, a difference of 2.9%.
Associate's Degree Correlation Summary
| Measurement | Spanish American | Ecuadorian |
| Minimum | 3.1% | 16.9% |
| Maximum | 53.4% | 62.8% |
| Range | 50.3% | 45.8% |
| Mean | 32.2% | 38.8% |
| Median | 33.5% | 41.1% |
| Interquartile 25% (IQ1) | 20.5% | 33.1% |
| Interquartile 75% (IQ3) | 41.7% | 45.4% |
| Interquartile Range (IQR) | 21.2% | 12.3% |
| Standard Deviation (Sample) | 11.9% | 9.7% |
| Standard Deviation (Population) | 11.8% | 9.7% |
Similar Demographics by Associate's Degree
Demographics Similar to Spanish Americans by Associate's Degree
In terms of associate's degree, the demographic groups most similar to Spanish Americans are Immigrants from Congo (41.8%, a difference of 0.060%), Immigrants from Guyana (41.8%, a difference of 0.18%), Japanese (41.7%, a difference of 0.22%), Cuban (41.9%, a difference of 0.27%), and Malaysian (41.6%, a difference of 0.32%).
| Demographics | Rating | Rank | Associate's Degree |
| U.S. Virgin Islanders | 0.7 /100 | #250 | Tragic 42.1% |
| Immigrants | Bahamas | 0.7 /100 | #251 | Tragic 42.1% |
| French American Indians | 0.6 /100 | #252 | Tragic 42.0% |
| Indonesians | 0.6 /100 | #253 | Tragic 41.9% |
| Cubans | 0.6 /100 | #254 | Tragic 41.9% |
| Immigrants | Guyana | 0.5 /100 | #255 | Tragic 41.8% |
| Immigrants | Congo | 0.5 /100 | #256 | Tragic 41.8% |
| Spanish Americans | 0.5 /100 | #257 | Tragic 41.8% |
| Japanese | 0.5 /100 | #258 | Tragic 41.7% |
| Malaysians | 0.4 /100 | #259 | Tragic 41.6% |
| Marshallese | 0.4 /100 | #260 | Tragic 41.6% |
| Nicaraguans | 0.4 /100 | #261 | Tragic 41.5% |
| Bahamians | 0.4 /100 | #262 | Tragic 41.5% |
| Immigrants | Jamaica | 0.3 /100 | #263 | Tragic 41.5% |
| Osage | 0.3 /100 | #264 | Tragic 41.5% |
Demographics Similar to Ecuadorians by Associate's Degree
In terms of associate's degree, the demographic groups most similar to Ecuadorians are Immigrants from St. Vincent and the Grenadines (42.9%, a difference of 0.080%), Tlingit-Haida (43.0%, a difference of 0.090%), Nonimmigrants (42.9%, a difference of 0.10%), Tongan (43.0%, a difference of 0.19%), and Native Hawaiian (43.1%, a difference of 0.35%).
| Demographics | Rating | Rank | Associate's Degree |
| Hmong | 3.2 /100 | #228 | Tragic 43.4% |
| Immigrants | Trinidad and Tobago | 3.0 /100 | #229 | Tragic 43.3% |
| Immigrants | Barbados | 2.9 /100 | #230 | Tragic 43.3% |
| Liberians | 2.9 /100 | #231 | Tragic 43.3% |
| Native Hawaiians | 2.3 /100 | #232 | Tragic 43.1% |
| Tongans | 2.2 /100 | #233 | Tragic 43.0% |
| Tlingit-Haida | 2.1 /100 | #234 | Tragic 43.0% |
| Ecuadorians | 2.0 /100 | #235 | Tragic 43.0% |
| Immigrants | St. Vincent and the Grenadines | 1.9 /100 | #236 | Tragic 42.9% |
| Immigrants | Nonimmigrants | 1.9 /100 | #237 | Tragic 42.9% |
| Iroquois | 1.7 /100 | #238 | Tragic 42.8% |
| Immigrants | Grenada | 1.3 /100 | #239 | Tragic 42.6% |
| Cree | 1.2 /100 | #240 | Tragic 42.5% |
| British West Indians | 1.0 /100 | #241 | Tragic 42.4% |
| Immigrants | West Indies | 1.0 /100 | #242 | Tragic 42.4% |