Immigrants from Pakistan vs Ecuadorian Associate's Degree
COMPARE
Immigrants from Pakistan
Ecuadorian
Associate's Degree
Associate's Degree Comparison
Immigrants from Pakistan
Ecuadorians
50.9%
ASSOCIATE'S DEGREE
99.5/ 100
METRIC RATING
72nd/ 347
METRIC RANK
43.0%
ASSOCIATE'S DEGREE
2.0/ 100
METRIC RATING
235th/ 347
METRIC RANK
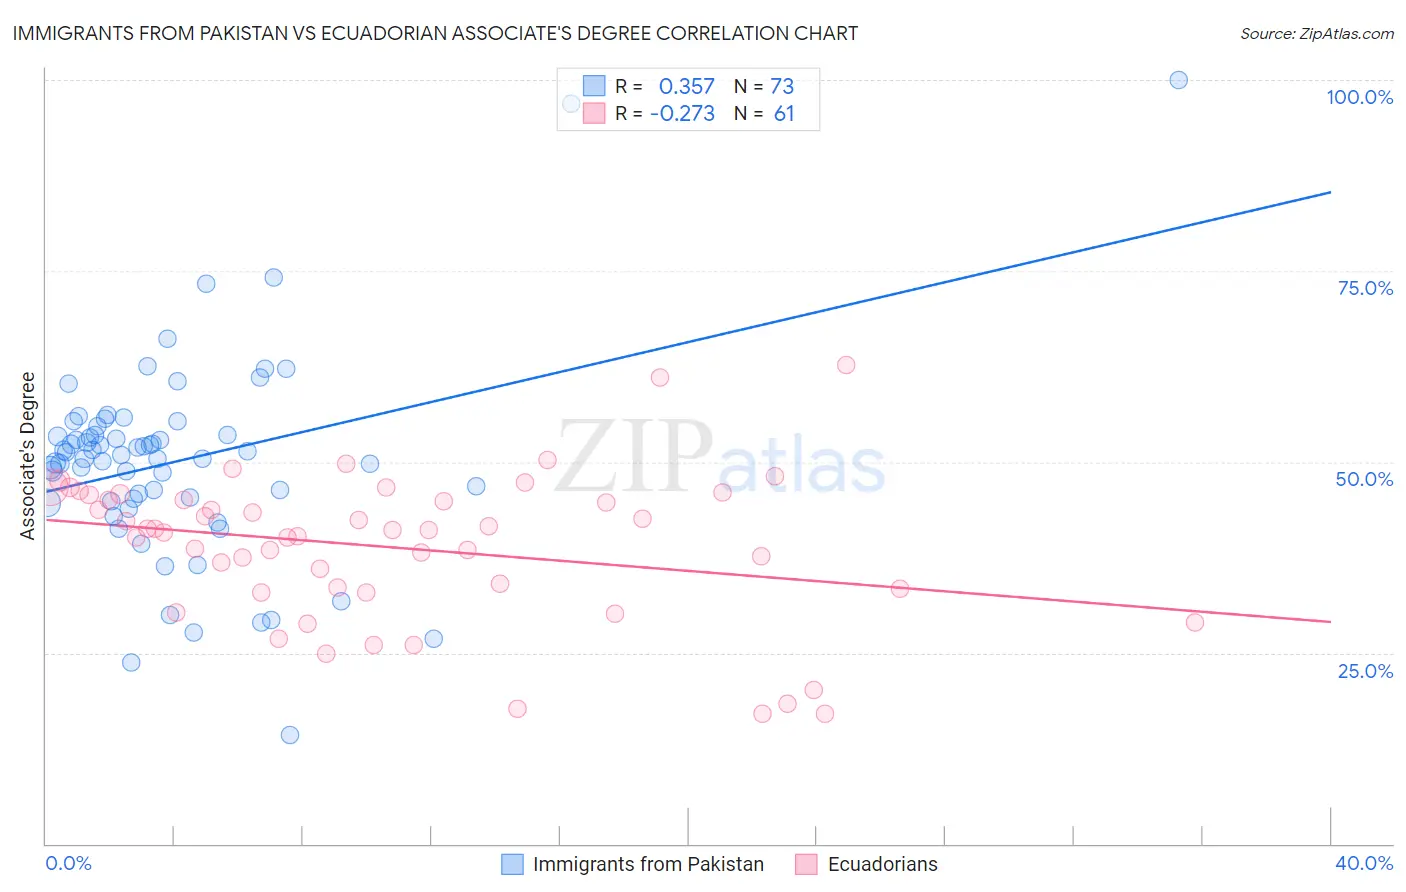
Immigrants from Pakistan vs Ecuadorian Associate's Degree Correlation Chart
The statistical analysis conducted on geographies consisting of 283,905,893 people shows a mild positive correlation between the proportion of Immigrants from Pakistan and percentage of population with at least associate's degree education in the United States with a correlation coefficient (R) of 0.357 and weighted average of 50.9%. Similarly, the statistical analysis conducted on geographies consisting of 317,844,783 people shows a weak negative correlation between the proportion of Ecuadorians and percentage of population with at least associate's degree education in the United States with a correlation coefficient (R) of -0.273 and weighted average of 43.0%, a difference of 18.4%.
Associate's Degree Correlation Summary
| Measurement | Immigrants from Pakistan | Ecuadorian |
| Minimum | 14.3% | 16.9% |
| Maximum | 100.0% | 62.8% |
| Range | 85.7% | 45.8% |
| Mean | 50.1% | 38.8% |
| Median | 50.9% | 41.1% |
| Interquartile 25% (IQ1) | 45.0% | 33.1% |
| Interquartile 75% (IQ3) | 54.1% | 45.4% |
| Interquartile Range (IQR) | 9.2% | 12.3% |
| Standard Deviation (Sample) | 13.3% | 9.7% |
| Standard Deviation (Population) | 13.2% | 9.7% |
Similar Demographics by Associate's Degree
Demographics Similar to Immigrants from Pakistan by Associate's Degree
In terms of associate's degree, the demographic groups most similar to Immigrants from Pakistan are Immigrants from Romania (50.9%, a difference of 0.060%), Immigrants from Argentina (50.9%, a difference of 0.070%), Egyptian (50.9%, a difference of 0.10%), Immigrants from Indonesia (51.0%, a difference of 0.22%), and Carpatho Rusyn (50.6%, a difference of 0.46%).
| Demographics | Rating | Rank | Associate's Degree |
| Zimbabweans | 99.7 /100 | #65 | Exceptional 51.3% |
| Immigrants | Europe | 99.7 /100 | #66 | Exceptional 51.3% |
| Argentineans | 99.6 /100 | #67 | Exceptional 51.2% |
| Immigrants | Indonesia | 99.5 /100 | #68 | Exceptional 51.0% |
| Egyptians | 99.5 /100 | #69 | Exceptional 50.9% |
| Immigrants | Argentina | 99.5 /100 | #70 | Exceptional 50.9% |
| Immigrants | Romania | 99.5 /100 | #71 | Exceptional 50.9% |
| Immigrants | Pakistan | 99.5 /100 | #72 | Exceptional 50.9% |
| Carpatho Rusyns | 99.3 /100 | #73 | Exceptional 50.6% |
| Lithuanians | 99.3 /100 | #74 | Exceptional 50.6% |
| Immigrants | Scotland | 99.3 /100 | #75 | Exceptional 50.6% |
| Immigrants | Zimbabwe | 99.2 /100 | #76 | Exceptional 50.5% |
| Immigrants | Lebanon | 99.1 /100 | #77 | Exceptional 50.5% |
| Immigrants | Eastern Europe | 99.1 /100 | #78 | Exceptional 50.5% |
| Ethiopians | 99.1 /100 | #79 | Exceptional 50.4% |
Demographics Similar to Ecuadorians by Associate's Degree
In terms of associate's degree, the demographic groups most similar to Ecuadorians are Immigrants from St. Vincent and the Grenadines (42.9%, a difference of 0.080%), Tlingit-Haida (43.0%, a difference of 0.090%), Nonimmigrants (42.9%, a difference of 0.10%), Tongan (43.0%, a difference of 0.19%), and Native Hawaiian (43.1%, a difference of 0.35%).
| Demographics | Rating | Rank | Associate's Degree |
| Hmong | 3.2 /100 | #228 | Tragic 43.4% |
| Immigrants | Trinidad and Tobago | 3.0 /100 | #229 | Tragic 43.3% |
| Immigrants | Barbados | 2.9 /100 | #230 | Tragic 43.3% |
| Liberians | 2.9 /100 | #231 | Tragic 43.3% |
| Native Hawaiians | 2.3 /100 | #232 | Tragic 43.1% |
| Tongans | 2.2 /100 | #233 | Tragic 43.0% |
| Tlingit-Haida | 2.1 /100 | #234 | Tragic 43.0% |
| Ecuadorians | 2.0 /100 | #235 | Tragic 43.0% |
| Immigrants | St. Vincent and the Grenadines | 1.9 /100 | #236 | Tragic 42.9% |
| Immigrants | Nonimmigrants | 1.9 /100 | #237 | Tragic 42.9% |
| Iroquois | 1.7 /100 | #238 | Tragic 42.8% |
| Immigrants | Grenada | 1.3 /100 | #239 | Tragic 42.6% |
| Cree | 1.2 /100 | #240 | Tragic 42.5% |
| British West Indians | 1.0 /100 | #241 | Tragic 42.4% |
| Immigrants | West Indies | 1.0 /100 | #242 | Tragic 42.4% |