Marshallese vs South American Indian Master's Degree
COMPARE
Marshallese
South American Indian
Master's Degree
Master's Degree Comparison
Marshallese
South American Indians
11.6%
MASTER'S DEGREE
0.1/ 100
METRIC RATING
295th/ 347
METRIC RANK
15.9%
MASTER'S DEGREE
88.4/ 100
METRIC RATING
135th/ 347
METRIC RANK
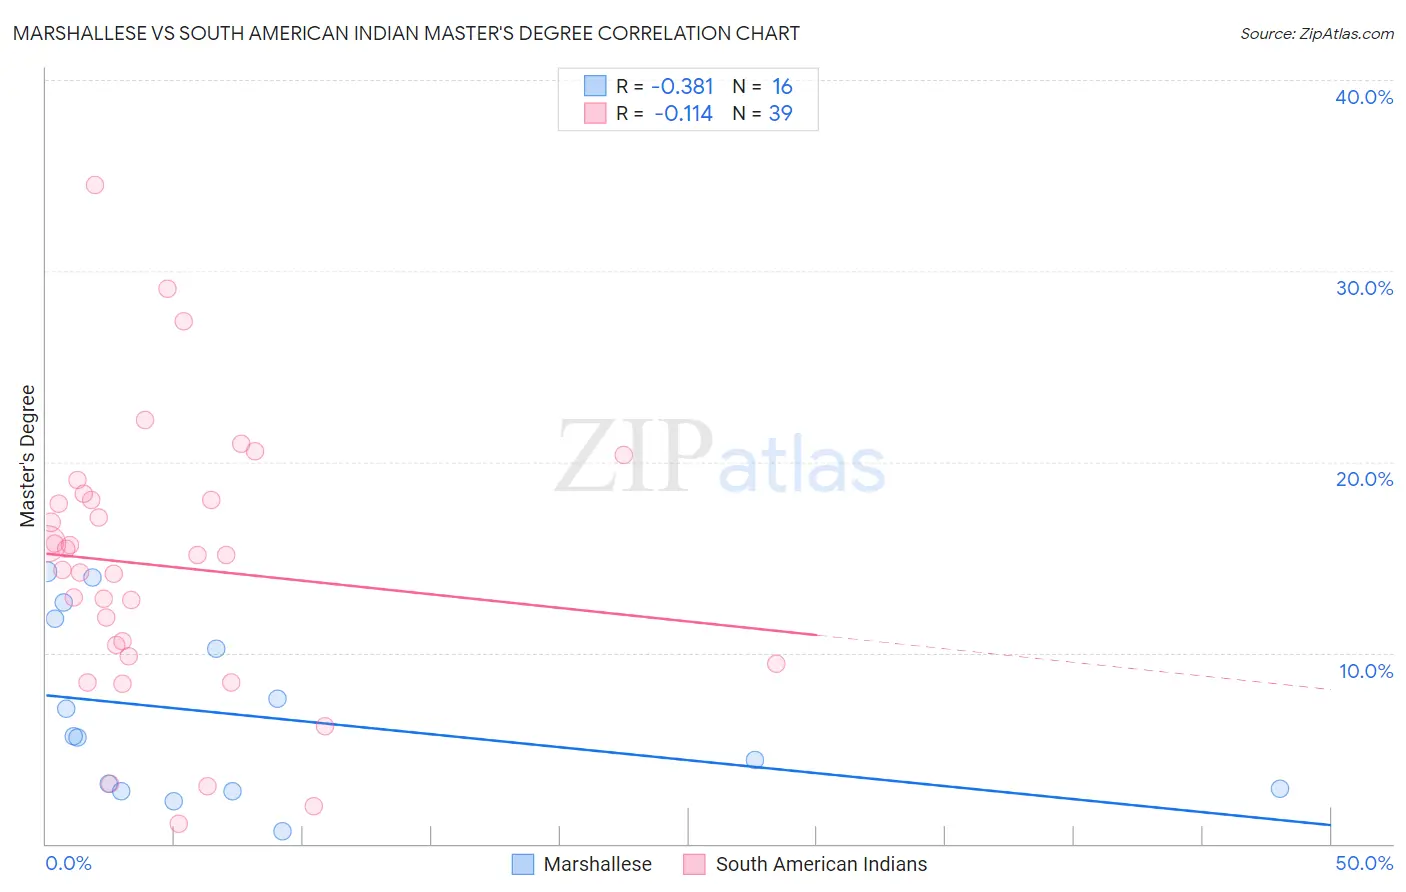
Marshallese vs South American Indian Master's Degree Correlation Chart
The statistical analysis conducted on geographies consisting of 14,761,315 people shows a mild negative correlation between the proportion of Marshallese and percentage of population with at least master's degree education in the United States with a correlation coefficient (R) of -0.381 and weighted average of 11.6%. Similarly, the statistical analysis conducted on geographies consisting of 164,560,944 people shows a poor negative correlation between the proportion of South American Indians and percentage of population with at least master's degree education in the United States with a correlation coefficient (R) of -0.114 and weighted average of 15.9%, a difference of 37.3%.
Master's Degree Correlation Summary
| Measurement | Marshallese | South American Indian |
| Minimum | 0.68% | 1.1% |
| Maximum | 14.2% | 34.5% |
| Range | 13.6% | 33.5% |
| Mean | 6.7% | 14.5% |
| Median | 5.6% | 15.1% |
| Interquartile 25% (IQ1) | 2.8% | 9.8% |
| Interquartile 75% (IQ3) | 11.0% | 18.0% |
| Interquartile Range (IQR) | 8.2% | 8.2% |
| Standard Deviation (Sample) | 4.5% | 7.1% |
| Standard Deviation (Population) | 4.4% | 7.0% |
Similar Demographics by Master's Degree
Demographics Similar to Marshallese by Master's Degree
In terms of master's degree, the demographic groups most similar to Marshallese are Alaskan Athabascan (11.6%, a difference of 0.010%), Immigrants from Yemen (11.6%, a difference of 0.13%), Hawaiian (11.6%, a difference of 0.15%), Alaska Native (11.6%, a difference of 0.25%), and Immigrants from Guatemala (11.6%, a difference of 0.48%).
| Demographics | Rating | Rank | Master's Degree |
| Immigrants | Honduras | 0.1 /100 | #288 | Tragic 11.8% |
| Guatemalans | 0.1 /100 | #289 | Tragic 11.7% |
| Ute | 0.1 /100 | #290 | Tragic 11.7% |
| Colville | 0.1 /100 | #291 | Tragic 11.6% |
| Immigrants | Guatemala | 0.1 /100 | #292 | Tragic 11.6% |
| Alaska Natives | 0.1 /100 | #293 | Tragic 11.6% |
| Hawaiians | 0.1 /100 | #294 | Tragic 11.6% |
| Marshallese | 0.1 /100 | #295 | Tragic 11.6% |
| Alaskan Athabascans | 0.1 /100 | #296 | Tragic 11.6% |
| Immigrants | Yemen | 0.1 /100 | #297 | Tragic 11.6% |
| Samoans | 0.1 /100 | #298 | Tragic 11.5% |
| Chickasaw | 0.1 /100 | #299 | Tragic 11.4% |
| Chippewa | 0.1 /100 | #300 | Tragic 11.4% |
| Tsimshian | 0.1 /100 | #301 | Tragic 11.4% |
| Cherokee | 0.1 /100 | #302 | Tragic 11.4% |
Demographics Similar to South American Indians by Master's Degree
In terms of master's degree, the demographic groups most similar to South American Indians are Venezuelan (15.9%, a difference of 0.0%), Assyrian/Chaldean/Syriac (15.8%, a difference of 0.45%), European (15.8%, a difference of 0.55%), Immigrants from Sudan (16.0%, a difference of 0.56%), and Pakistani (15.8%, a difference of 0.63%).
| Demographics | Rating | Rank | Master's Degree |
| Immigrants | Sierra Leone | 94.7 /100 | #128 | Exceptional 16.3% |
| Immigrants | Syria | 93.3 /100 | #129 | Exceptional 16.2% |
| Immigrants | Jordan | 92.7 /100 | #130 | Exceptional 16.1% |
| Taiwanese | 91.9 /100 | #131 | Exceptional 16.1% |
| Serbians | 91.7 /100 | #132 | Exceptional 16.1% |
| Immigrants | Sudan | 90.2 /100 | #133 | Exceptional 16.0% |
| Venezuelans | 88.4 /100 | #134 | Excellent 15.9% |
| South American Indians | 88.4 /100 | #135 | Excellent 15.9% |
| Assyrians/Chaldeans/Syriacs | 86.8 /100 | #136 | Excellent 15.8% |
| Europeans | 86.4 /100 | #137 | Excellent 15.8% |
| Pakistanis | 86.1 /100 | #138 | Excellent 15.8% |
| Immigrants | Germany | 85.9 /100 | #139 | Excellent 15.8% |
| Vietnamese | 85.5 /100 | #140 | Excellent 15.8% |
| Poles | 85.0 /100 | #141 | Excellent 15.7% |
| Immigrants | Africa | 84.0 /100 | #142 | Excellent 15.7% |