Basque vs South American Indian Master's Degree
COMPARE
Basque
South American Indian
Master's Degree
Master's Degree Comparison
Basques
South American Indians
14.7%
MASTER'S DEGREE
36.5/ 100
METRIC RATING
187th/ 347
METRIC RANK
15.9%
MASTER'S DEGREE
88.4/ 100
METRIC RATING
135th/ 347
METRIC RANK
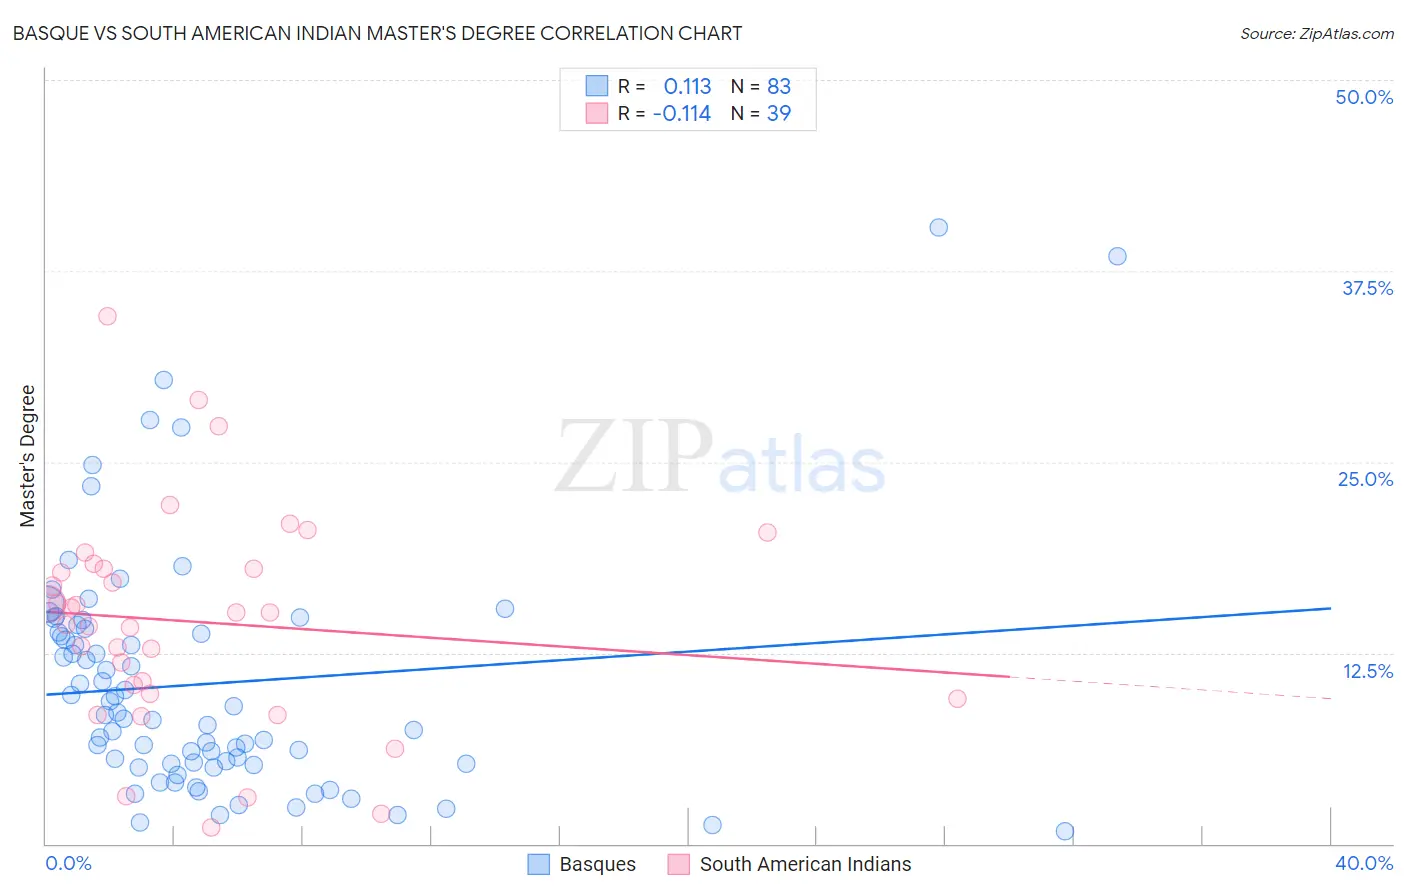
Basque vs South American Indian Master's Degree Correlation Chart
The statistical analysis conducted on geographies consisting of 165,765,652 people shows a poor positive correlation between the proportion of Basques and percentage of population with at least master's degree education in the United States with a correlation coefficient (R) of 0.113 and weighted average of 14.7%. Similarly, the statistical analysis conducted on geographies consisting of 164,560,944 people shows a poor negative correlation between the proportion of South American Indians and percentage of population with at least master's degree education in the United States with a correlation coefficient (R) of -0.114 and weighted average of 15.9%, a difference of 8.4%.
Master's Degree Correlation Summary
| Measurement | Basque | South American Indian |
| Minimum | 0.80% | 1.1% |
| Maximum | 40.4% | 34.5% |
| Range | 39.6% | 33.5% |
| Mean | 10.5% | 14.5% |
| Median | 8.4% | 15.1% |
| Interquartile 25% (IQ1) | 5.2% | 9.8% |
| Interquartile 75% (IQ3) | 14.1% | 18.0% |
| Interquartile Range (IQR) | 8.9% | 8.2% |
| Standard Deviation (Sample) | 7.8% | 7.1% |
| Standard Deviation (Population) | 7.8% | 7.0% |
Similar Demographics by Master's Degree
Demographics Similar to Basques by Master's Degree
In terms of master's degree, the demographic groups most similar to Basques are Immigrants from Costa Rica (14.7%, a difference of 0.040%), Immigrants from Oceania (14.7%, a difference of 0.080%), Immigrants (14.6%, a difference of 0.080%), Spaniard (14.6%, a difference of 0.10%), and Barbadian (14.7%, a difference of 0.24%).
| Demographics | Rating | Rank | Master's Degree |
| Celtics | 41.3 /100 | #180 | Average 14.8% |
| Swiss | 41.1 /100 | #181 | Average 14.7% |
| Czechs | 40.4 /100 | #182 | Average 14.7% |
| Sri Lankans | 39.6 /100 | #183 | Fair 14.7% |
| Immigrants | Zaire | 39.5 /100 | #184 | Fair 14.7% |
| Barbadians | 38.3 /100 | #185 | Fair 14.7% |
| Immigrants | Oceania | 37.1 /100 | #186 | Fair 14.7% |
| Basques | 36.5 /100 | #187 | Fair 14.7% |
| Immigrants | Costa Rica | 36.2 /100 | #188 | Fair 14.7% |
| Immigrants | Immigrants | 36.0 /100 | #189 | Fair 14.6% |
| Spaniards | 35.8 /100 | #190 | Fair 14.6% |
| Welsh | 34.2 /100 | #191 | Fair 14.6% |
| Immigrants | Middle Africa | 33.6 /100 | #192 | Fair 14.6% |
| Immigrants | Nigeria | 32.7 /100 | #193 | Fair 14.6% |
| Chinese | 32.5 /100 | #194 | Fair 14.6% |
Demographics Similar to South American Indians by Master's Degree
In terms of master's degree, the demographic groups most similar to South American Indians are Venezuelan (15.9%, a difference of 0.0%), Assyrian/Chaldean/Syriac (15.8%, a difference of 0.45%), European (15.8%, a difference of 0.55%), Immigrants from Sudan (16.0%, a difference of 0.56%), and Pakistani (15.8%, a difference of 0.63%).
| Demographics | Rating | Rank | Master's Degree |
| Immigrants | Sierra Leone | 94.7 /100 | #128 | Exceptional 16.3% |
| Immigrants | Syria | 93.3 /100 | #129 | Exceptional 16.2% |
| Immigrants | Jordan | 92.7 /100 | #130 | Exceptional 16.1% |
| Taiwanese | 91.9 /100 | #131 | Exceptional 16.1% |
| Serbians | 91.7 /100 | #132 | Exceptional 16.1% |
| Immigrants | Sudan | 90.2 /100 | #133 | Exceptional 16.0% |
| Venezuelans | 88.4 /100 | #134 | Excellent 15.9% |
| South American Indians | 88.4 /100 | #135 | Excellent 15.9% |
| Assyrians/Chaldeans/Syriacs | 86.8 /100 | #136 | Excellent 15.8% |
| Europeans | 86.4 /100 | #137 | Excellent 15.8% |
| Pakistanis | 86.1 /100 | #138 | Excellent 15.8% |
| Immigrants | Germany | 85.9 /100 | #139 | Excellent 15.8% |
| Vietnamese | 85.5 /100 | #140 | Excellent 15.8% |
| Poles | 85.0 /100 | #141 | Excellent 15.7% |
| Immigrants | Africa | 84.0 /100 | #142 | Excellent 15.7% |