Asian vs South American Indian Householder Income Ages 45 - 64 years
COMPARE
Asian
South American Indian
Householder Income Ages 45 - 64 years
Householder Income Ages 45 - 64 years Comparison
Asians
South American Indians
$118,426
HOUSEHOLDER INCOME AGES 45 - 64 YEARS
100.0/ 100
METRIC RATING
25th/ 347
METRIC RANK
$101,171
HOUSEHOLDER INCOME AGES 45 - 64 YEARS
60.5/ 100
METRIC RATING
168th/ 347
METRIC RANK
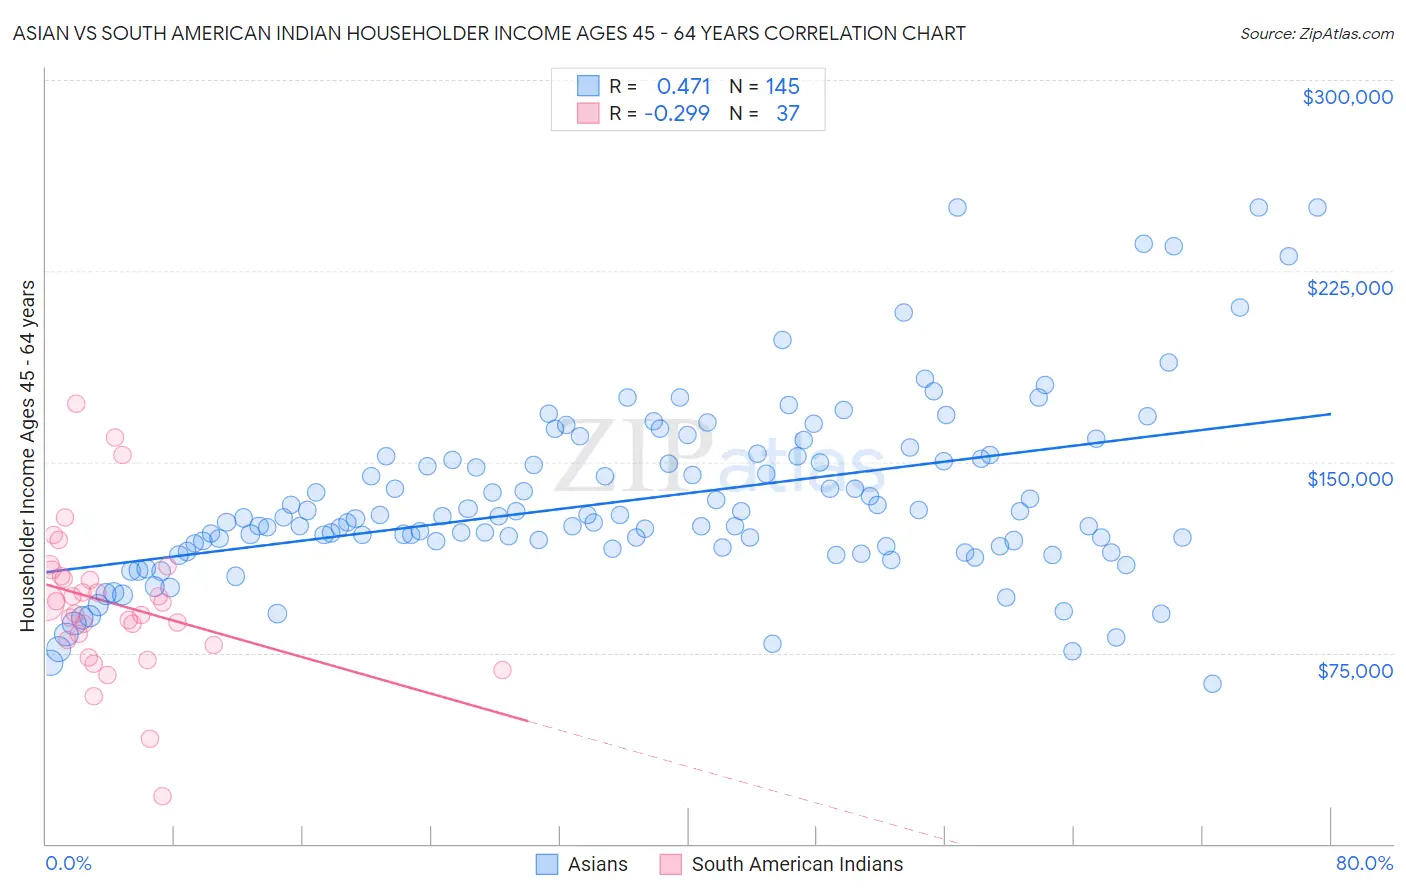
Asian vs South American Indian Householder Income Ages 45 - 64 years Correlation Chart
The statistical analysis conducted on geographies consisting of 548,262,581 people shows a moderate positive correlation between the proportion of Asians and household income with householder between the ages 45 and 64 in the United States with a correlation coefficient (R) of 0.471 and weighted average of $118,426. Similarly, the statistical analysis conducted on geographies consisting of 164,498,576 people shows a weak negative correlation between the proportion of South American Indians and household income with householder between the ages 45 and 64 in the United States with a correlation coefficient (R) of -0.299 and weighted average of $101,171, a difference of 17.1%.
Householder Income Ages 45 - 64 years Correlation Summary
| Measurement | Asian | South American Indian |
| Minimum | $62,982 | $18,682 |
| Maximum | $250,001 | $173,033 |
| Range | $187,019 | $154,351 |
| Mean | $135,000 | $94,461 |
| Median | $127,763 | $94,583 |
| Interquartile 25% (IQ1) | $116,265 | $79,132 |
| Interquartile 75% (IQ3) | $151,736 | $106,330 |
| Interquartile Range (IQR) | $35,471 | $27,199 |
| Standard Deviation (Sample) | $35,213 | $29,348 |
| Standard Deviation (Population) | $35,092 | $28,948 |
Similar Demographics by Householder Income Ages 45 - 64 years
Demographics Similar to Asians by Householder Income Ages 45 - 64 years
In terms of householder income ages 45 - 64 years, the demographic groups most similar to Asians are Immigrants from Japan ($118,498, a difference of 0.060%), Immigrants from Sweden ($118,318, a difference of 0.090%), Bolivian ($118,871, a difference of 0.38%), Immigrants from Northern Europe ($117,930, a difference of 0.42%), and Immigrants from Belgium ($118,932, a difference of 0.43%).
| Demographics | Rating | Rank | Householder Income Ages 45 - 64 years |
| Immigrants | Korea | 100.0 /100 | #18 | Exceptional $121,243 |
| Eastern Europeans | 100.0 /100 | #19 | Exceptional $120,684 |
| Immigrants | Australia | 100.0 /100 | #20 | Exceptional $119,308 |
| Immigrants | Sri Lanka | 100.0 /100 | #21 | Exceptional $119,094 |
| Immigrants | Belgium | 100.0 /100 | #22 | Exceptional $118,932 |
| Bolivians | 100.0 /100 | #23 | Exceptional $118,871 |
| Immigrants | Japan | 100.0 /100 | #24 | Exceptional $118,498 |
| Asians | 100.0 /100 | #25 | Exceptional $118,426 |
| Immigrants | Sweden | 100.0 /100 | #26 | Exceptional $118,318 |
| Immigrants | Northern Europe | 100.0 /100 | #27 | Exceptional $117,930 |
| Turks | 100.0 /100 | #28 | Exceptional $117,814 |
| Bhutanese | 100.0 /100 | #29 | Exceptional $117,750 |
| Immigrants | Bolivia | 100.0 /100 | #30 | Exceptional $117,731 |
| Immigrants | Asia | 100.0 /100 | #31 | Exceptional $116,566 |
| Russians | 100.0 /100 | #32 | Exceptional $116,328 |
Demographics Similar to South American Indians by Householder Income Ages 45 - 64 years
In terms of householder income ages 45 - 64 years, the demographic groups most similar to South American Indians are Guamanian/Chamorro ($101,170, a difference of 0.0%), Slovak ($101,029, a difference of 0.14%), Czechoslovakian ($101,387, a difference of 0.21%), South American ($100,837, a difference of 0.33%), and Samoan ($101,580, a difference of 0.40%).
| Demographics | Rating | Rank | Householder Income Ages 45 - 64 years |
| Immigrants | Nepal | 71.8 /100 | #161 | Good $102,190 |
| Scottish | 71.1 /100 | #162 | Good $102,123 |
| English | 70.1 /100 | #163 | Good $102,021 |
| Immigrants | Morocco | 70.0 /100 | #164 | Good $102,015 |
| Immigrants | Albania | 69.4 /100 | #165 | Good $101,957 |
| Samoans | 65.3 /100 | #166 | Good $101,580 |
| Czechoslovakians | 63.0 /100 | #167 | Good $101,387 |
| South American Indians | 60.5 /100 | #168 | Good $101,171 |
| Guamanians/Chamorros | 60.5 /100 | #169 | Good $101,170 |
| Slovaks | 58.8 /100 | #170 | Average $101,029 |
| South Americans | 56.4 /100 | #171 | Average $100,837 |
| Immigrants | Uzbekistan | 52.5 /100 | #172 | Average $100,523 |
| Alsatians | 51.4 /100 | #173 | Average $100,435 |
| Welsh | 50.0 /100 | #174 | Average $100,322 |
| Germans | 48.8 /100 | #175 | Average $100,224 |