Asian vs South American Indian Disability Age Over 75
COMPARE
Asian
South American Indian
Disability Age Over 75
Disability Age Over 75 Comparison
Asians
South American Indians
46.9%
DISABILITY AGE OVER 75
81.6/ 100
METRIC RATING
148th/ 347
METRIC RANK
47.1%
DISABILITY AGE OVER 75
68.1/ 100
METRIC RATING
161st/ 347
METRIC RANK
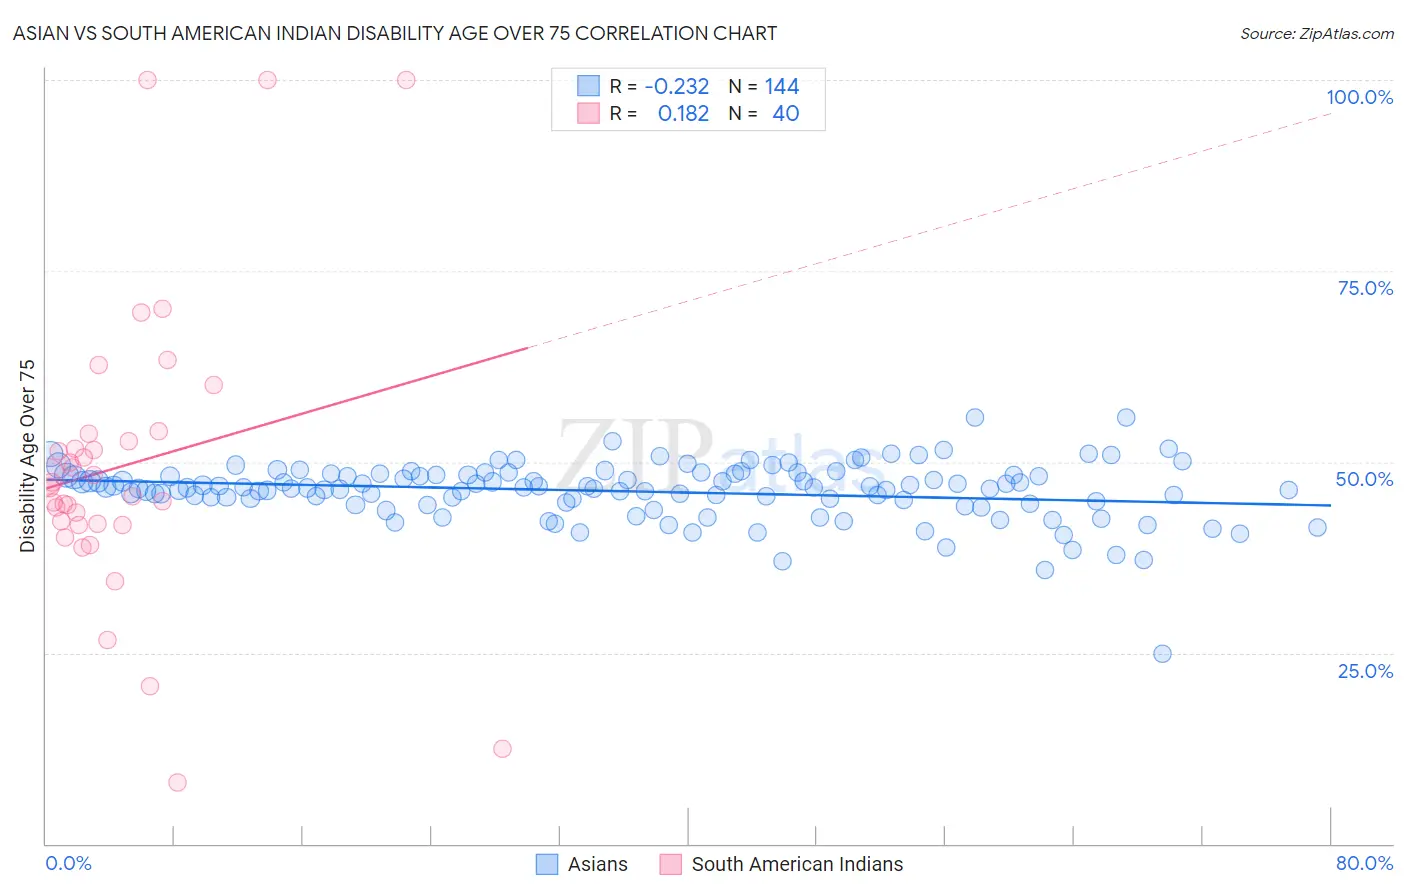
Asian vs South American Indian Disability Age Over 75 Correlation Chart
The statistical analysis conducted on geographies consisting of 549,007,730 people shows a weak negative correlation between the proportion of Asians and percentage of population with a disability over the age of 75 in the United States with a correlation coefficient (R) of -0.232 and weighted average of 46.9%. Similarly, the statistical analysis conducted on geographies consisting of 164,514,334 people shows a poor positive correlation between the proportion of South American Indians and percentage of population with a disability over the age of 75 in the United States with a correlation coefficient (R) of 0.182 and weighted average of 47.1%, a difference of 0.41%.
Disability Age Over 75 Correlation Summary
| Measurement | Asian | South American Indian |
| Minimum | 24.9% | 8.0% |
| Maximum | 55.8% | 100.0% |
| Range | 30.9% | 92.0% |
| Mean | 46.1% | 49.5% |
| Median | 46.6% | 47.0% |
| Interquartile 25% (IQ1) | 44.8% | 41.8% |
| Interquartile 75% (IQ3) | 48.3% | 53.2% |
| Interquartile Range (IQR) | 3.5% | 11.4% |
| Standard Deviation (Sample) | 3.8% | 19.2% |
| Standard Deviation (Population) | 3.8% | 19.0% |
Demographics Similar to Asians and South American Indians by Disability Age Over 75
In terms of disability age over 75, the demographic groups most similar to Asians are Welsh (47.0%, a difference of 0.010%), Immigrants from Russia (47.0%, a difference of 0.080%), French Canadian (47.0%, a difference of 0.090%), Immigrants from Peru (46.9%, a difference of 0.10%), and Guyanese (46.9%, a difference of 0.11%). Similarly, the demographic groups most similar to South American Indians are Immigrants from Middle Africa (47.1%, a difference of 0.010%), Pennsylvania German (47.2%, a difference of 0.050%), Immigrants from Eastern Africa (47.2%, a difference of 0.070%), Immigrants from Morocco (47.1%, a difference of 0.090%), and French (47.2%, a difference of 0.090%).
| Demographics | Rating | Rank | Disability Age Over 75 |
| Venezuelans | 85.0 /100 | #144 | Excellent 46.9% |
| Costa Ricans | 84.5 /100 | #145 | Excellent 46.9% |
| Guyanese | 84.3 /100 | #146 | Excellent 46.9% |
| Immigrants | Peru | 84.1 /100 | #147 | Excellent 46.9% |
| Asians | 81.6 /100 | #148 | Excellent 46.9% |
| Welsh | 81.3 /100 | #149 | Excellent 47.0% |
| Immigrants | Russia | 79.3 /100 | #150 | Good 47.0% |
| French Canadians | 79.0 /100 | #151 | Good 47.0% |
| Immigrants | Asia | 76.5 /100 | #152 | Good 47.0% |
| Immigrants | Zaire | 74.8 /100 | #153 | Good 47.1% |
| Immigrants | Belarus | 74.8 /100 | #154 | Good 47.1% |
| Immigrants | Iran | 74.7 /100 | #155 | Good 47.1% |
| Arabs | 73.3 /100 | #156 | Good 47.1% |
| Bhutanese | 72.6 /100 | #157 | Good 47.1% |
| Immigrants | Guyana | 71.9 /100 | #158 | Good 47.1% |
| Immigrants | Morocco | 71.4 /100 | #159 | Good 47.1% |
| Immigrants | Middle Africa | 68.3 /100 | #160 | Good 47.1% |
| South American Indians | 68.1 /100 | #161 | Good 47.1% |
| Pennsylvania Germans | 66.0 /100 | #162 | Good 47.2% |
| Immigrants | Eastern Africa | 65.5 /100 | #163 | Good 47.2% |
| French | 64.6 /100 | #164 | Good 47.2% |