Asian vs South American Indian In Labor Force | Age 35-44
COMPARE
Asian
South American Indian
In Labor Force | Age 35-44
In Labor Force | Age 35-44 Comparison
Asians
South American Indians
84.7%
IN LABOR FORCE | AGE 35-44
90.6/ 100
METRIC RATING
126th/ 347
METRIC RANK
84.5%
IN LABOR FORCE | AGE 35-44
73.6/ 100
METRIC RATING
148th/ 347
METRIC RANK
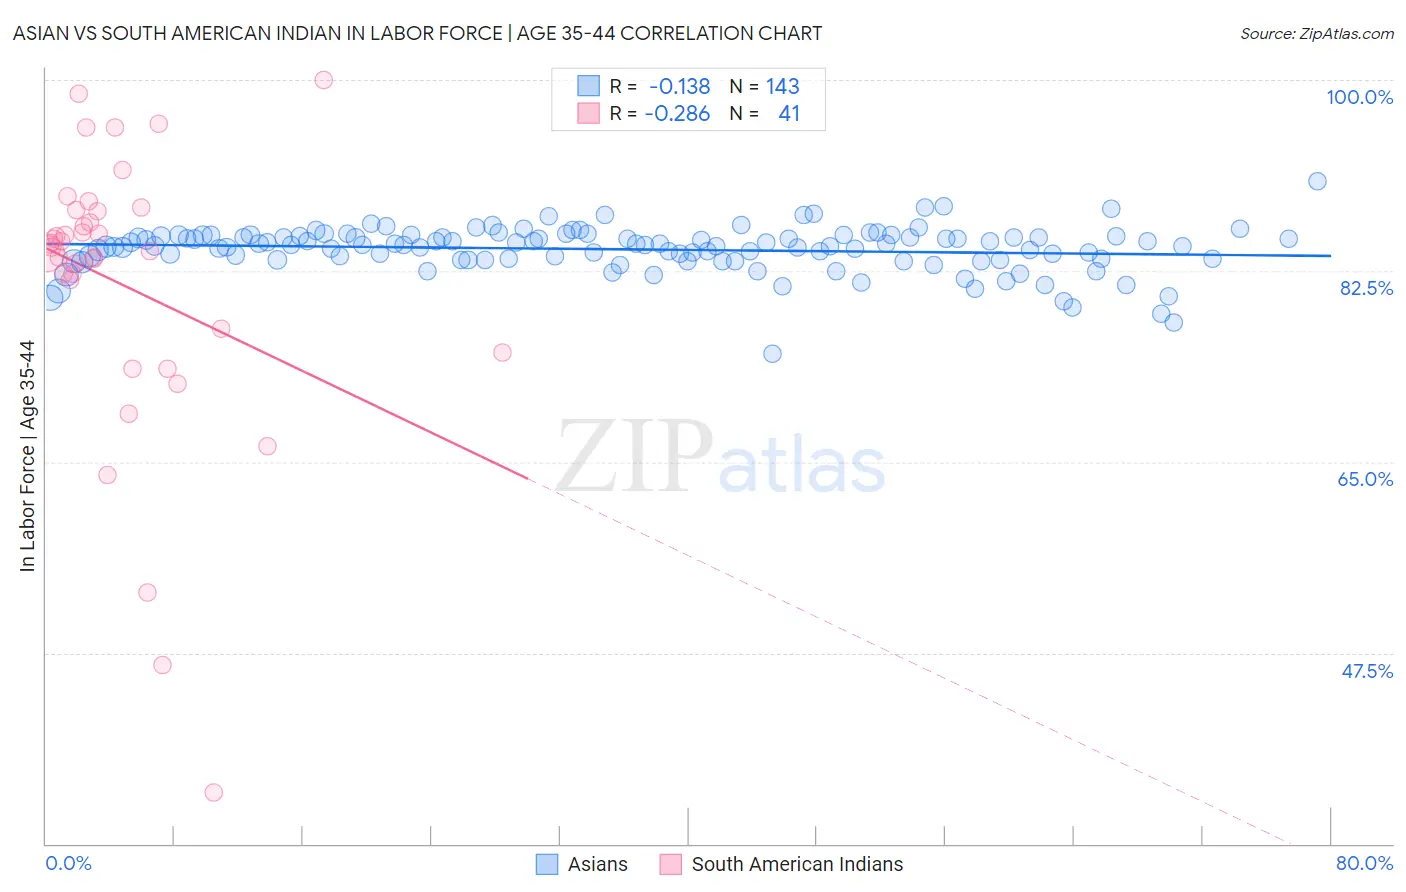
Asian vs South American Indian In Labor Force | Age 35-44 Correlation Chart
The statistical analysis conducted on geographies consisting of 550,310,951 people shows a poor negative correlation between the proportion of Asians and labor force participation rate among population between the ages 35 and 44 in the United States with a correlation coefficient (R) of -0.138 and weighted average of 84.7%. Similarly, the statistical analysis conducted on geographies consisting of 164,541,047 people shows a weak negative correlation between the proportion of South American Indians and labor force participation rate among population between the ages 35 and 44 in the United States with a correlation coefficient (R) of -0.286 and weighted average of 84.5%, a difference of 0.20%.
In Labor Force | Age 35-44 Correlation Summary
| Measurement | Asian | South American Indian |
| Minimum | 74.9% | 34.7% |
| Maximum | 90.7% | 100.0% |
| Range | 15.8% | 65.3% |
| Mean | 84.5% | 81.3% |
| Median | 84.9% | 84.7% |
| Interquartile 25% (IQ1) | 83.5% | 76.1% |
| Interquartile 75% (IQ3) | 85.6% | 88.0% |
| Interquartile Range (IQR) | 2.1% | 11.9% |
| Standard Deviation (Sample) | 2.1% | 13.2% |
| Standard Deviation (Population) | 2.1% | 13.1% |
Similar Demographics by In Labor Force | Age 35-44
Demographics Similar to Asians by In Labor Force | Age 35-44
In terms of in labor force | age 35-44, the demographic groups most similar to Asians are Slavic (84.7%, a difference of 0.0%), Maltese (84.7%, a difference of 0.0%), Immigrants from Spain (84.7%, a difference of 0.0%), Immigrants from Ghana (84.7%, a difference of 0.0%), and Finnish (84.7%, a difference of 0.010%).
| Demographics | Rating | Rank | In Labor Force | Age 35-44 |
| Burmese | 91.8 /100 | #119 | Exceptional 84.7% |
| Immigrants | Northern Europe | 91.5 /100 | #120 | Exceptional 84.7% |
| Finns | 91.2 /100 | #121 | Exceptional 84.7% |
| Germans | 91.0 /100 | #122 | Exceptional 84.7% |
| Immigrants | South America | 90.9 /100 | #123 | Exceptional 84.7% |
| Slavs | 90.8 /100 | #124 | Exceptional 84.7% |
| Maltese | 90.8 /100 | #125 | Exceptional 84.7% |
| Asians | 90.6 /100 | #126 | Exceptional 84.7% |
| Immigrants | Spain | 90.6 /100 | #127 | Exceptional 84.7% |
| Immigrants | Ghana | 90.4 /100 | #128 | Exceptional 84.7% |
| Palestinians | 89.7 /100 | #129 | Excellent 84.7% |
| Bhutanese | 89.7 /100 | #130 | Excellent 84.7% |
| Immigrants | Scotland | 89.6 /100 | #131 | Excellent 84.7% |
| Austrians | 89.4 /100 | #132 | Excellent 84.7% |
| Argentineans | 88.4 /100 | #133 | Excellent 84.6% |
Demographics Similar to South American Indians by In Labor Force | Age 35-44
In terms of in labor force | age 35-44, the demographic groups most similar to South American Indians are Okinawan (84.5%, a difference of 0.0%), Immigrants from Nigeria (84.5%, a difference of 0.0%), Romanian (84.5%, a difference of 0.010%), Immigrants from Taiwan (84.5%, a difference of 0.020%), and Immigrants from Netherlands (84.5%, a difference of 0.030%).
| Demographics | Rating | Rank | In Labor Force | Age 35-44 |
| Immigrants | Belgium | 80.8 /100 | #141 | Excellent 84.6% |
| Immigrants | Uruguay | 80.1 /100 | #142 | Excellent 84.6% |
| Immigrants | Ukraine | 79.7 /100 | #143 | Good 84.6% |
| Immigrants | Jamaica | 79.4 /100 | #144 | Good 84.6% |
| Immigrants | Saudi Arabia | 79.4 /100 | #145 | Good 84.6% |
| Immigrants | Asia | 78.7 /100 | #146 | Good 84.5% |
| Immigrants | Netherlands | 76.6 /100 | #147 | Good 84.5% |
| South American Indians | 73.6 /100 | #148 | Good 84.5% |
| Okinawans | 73.5 /100 | #149 | Good 84.5% |
| Immigrants | Nigeria | 73.3 /100 | #150 | Good 84.5% |
| Romanians | 72.1 /100 | #151 | Good 84.5% |
| Immigrants | Taiwan | 71.4 /100 | #152 | Good 84.5% |
| Trinidadians and Tobagonians | 69.5 /100 | #153 | Good 84.5% |
| Iranians | 69.4 /100 | #154 | Good 84.5% |
| Immigrants | Switzerland | 65.9 /100 | #155 | Good 84.5% |