Armenian vs Immigrants from Senegal Master's Degree
COMPARE
Armenian
Immigrants from Senegal
Master's Degree
Master's Degree Comparison
Armenians
Immigrants from Senegal
16.8%
MASTER'S DEGREE
98.0/ 100
METRIC RATING
107th/ 347
METRIC RANK
15.5%
MASTER'S DEGREE
78.2/ 100
METRIC RATING
148th/ 347
METRIC RANK
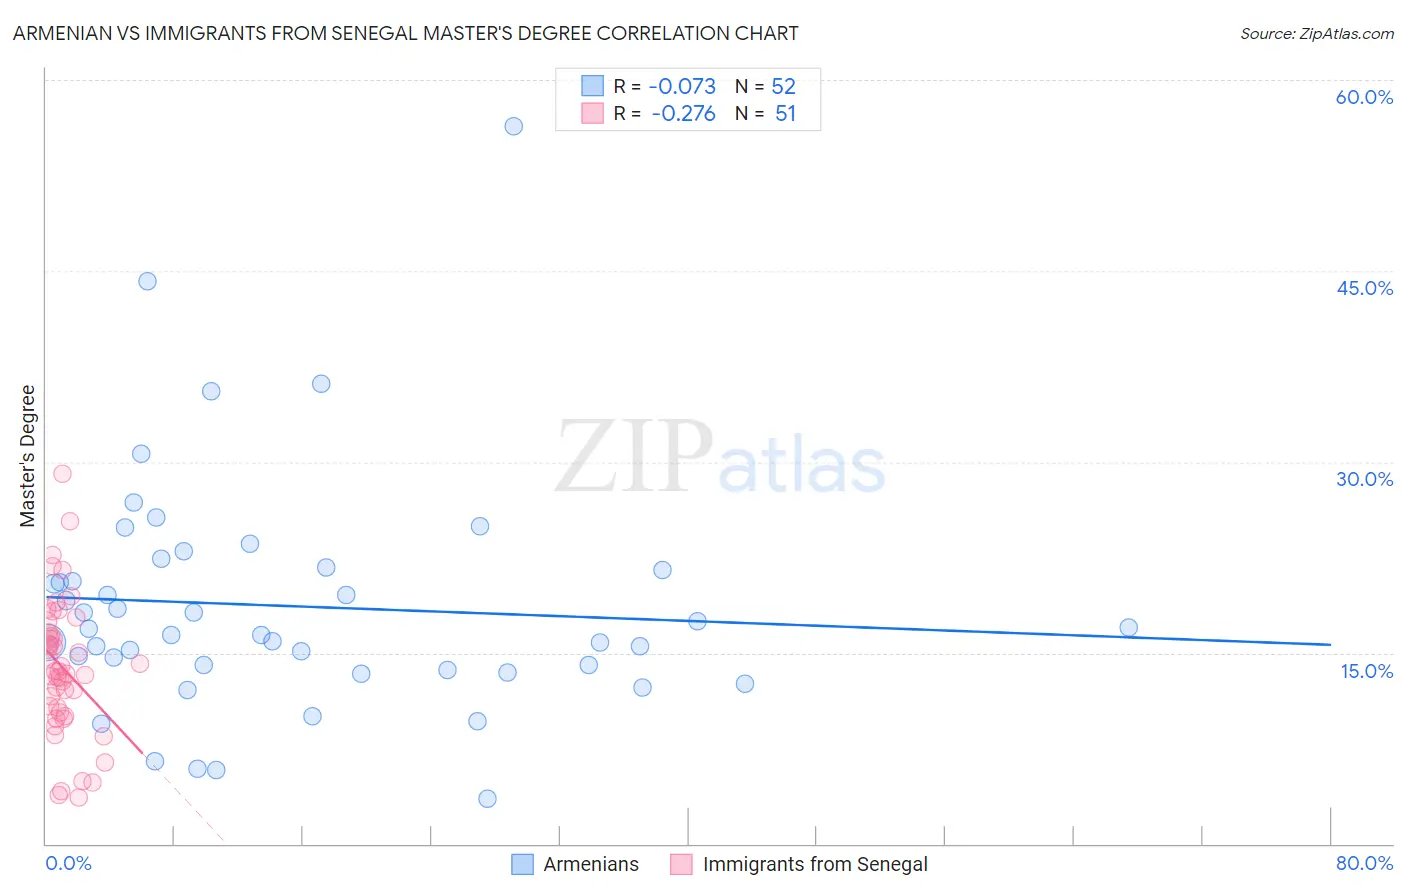
Armenian vs Immigrants from Senegal Master's Degree Correlation Chart
The statistical analysis conducted on geographies consisting of 310,885,780 people shows a slight negative correlation between the proportion of Armenians and percentage of population with at least master's degree education in the United States with a correlation coefficient (R) of -0.073 and weighted average of 16.8%. Similarly, the statistical analysis conducted on geographies consisting of 90,124,695 people shows a weak negative correlation between the proportion of Immigrants from Senegal and percentage of population with at least master's degree education in the United States with a correlation coefficient (R) of -0.276 and weighted average of 15.5%, a difference of 8.1%.
Master's Degree Correlation Summary
| Measurement | Armenian | Immigrants from Senegal |
| Minimum | 3.6% | 3.7% |
| Maximum | 56.3% | 29.1% |
| Range | 52.8% | 25.4% |
| Mean | 18.7% | 13.8% |
| Median | 16.7% | 13.5% |
| Interquartile 25% (IQ1) | 13.8% | 10.3% |
| Interquartile 75% (IQ3) | 21.6% | 16.6% |
| Interquartile Range (IQR) | 7.7% | 6.3% |
| Standard Deviation (Sample) | 9.3% | 5.4% |
| Standard Deviation (Population) | 9.2% | 5.3% |
Similar Demographics by Master's Degree
Demographics Similar to Armenians by Master's Degree
In terms of master's degree, the demographic groups most similar to Armenians are Sierra Leonean (16.8%, a difference of 0.030%), Moroccan (16.8%, a difference of 0.050%), Immigrants from Chile (16.8%, a difference of 0.080%), Immigrants from Albania (16.8%, a difference of 0.090%), and Austrian (16.7%, a difference of 0.35%).
| Demographics | Rating | Rank | Master's Degree |
| Albanians | 98.7 /100 | #100 | Exceptional 17.0% |
| Immigrants | Nepal | 98.6 /100 | #101 | Exceptional 17.0% |
| Chileans | 98.6 /100 | #102 | Exceptional 16.9% |
| Alsatians | 98.4 /100 | #103 | Exceptional 16.9% |
| Ukrainians | 98.3 /100 | #104 | Exceptional 16.9% |
| Syrians | 98.3 /100 | #105 | Exceptional 16.8% |
| Immigrants | Albania | 98.1 /100 | #106 | Exceptional 16.8% |
| Armenians | 98.0 /100 | #107 | Exceptional 16.8% |
| Sierra Leoneans | 98.0 /100 | #108 | Exceptional 16.8% |
| Moroccans | 98.0 /100 | #109 | Exceptional 16.8% |
| Immigrants | Chile | 98.0 /100 | #110 | Exceptional 16.8% |
| Austrians | 97.8 /100 | #111 | Exceptional 16.7% |
| Macedonians | 97.7 /100 | #112 | Exceptional 16.7% |
| Arabs | 97.7 /100 | #113 | Exceptional 16.7% |
| Northern Europeans | 97.6 /100 | #114 | Exceptional 16.7% |
Demographics Similar to Immigrants from Senegal by Master's Degree
In terms of master's degree, the demographic groups most similar to Immigrants from Senegal are Ghanaian (15.5%, a difference of 0.010%), Slovene (15.5%, a difference of 0.040%), Iraqi (15.5%, a difference of 0.16%), Hungarian (15.6%, a difference of 0.17%), and Immigrants from Afghanistan (15.6%, a difference of 0.21%).
| Demographics | Rating | Rank | Master's Degree |
| Poles | 85.0 /100 | #141 | Excellent 15.7% |
| Immigrants | Africa | 84.0 /100 | #142 | Excellent 15.7% |
| Immigrants | Venezuela | 83.6 /100 | #143 | Excellent 15.7% |
| Canadians | 83.3 /100 | #144 | Excellent 15.7% |
| South Americans | 81.3 /100 | #145 | Excellent 15.6% |
| Immigrants | Afghanistan | 79.4 /100 | #146 | Good 15.6% |
| Hungarians | 79.1 /100 | #147 | Good 15.6% |
| Immigrants | Senegal | 78.2 /100 | #148 | Good 15.5% |
| Ghanaians | 78.2 /100 | #149 | Good 15.5% |
| Slovenes | 78.0 /100 | #150 | Good 15.5% |
| Iraqis | 77.3 /100 | #151 | Good 15.5% |
| Slavs | 77.0 /100 | #152 | Good 15.5% |
| Icelanders | 76.8 /100 | #153 | Good 15.5% |
| Immigrants | South America | 76.3 /100 | #154 | Good 15.5% |
| Immigrants | Bangladesh | 76.1 /100 | #155 | Good 15.5% |