Palestinian vs Immigrants from Senegal Master's Degree
COMPARE
Palestinian
Immigrants from Senegal
Master's Degree
Master's Degree Comparison
Palestinians
Immigrants from Senegal
16.3%
MASTER'S DEGREE
94.8/ 100
METRIC RATING
127th/ 347
METRIC RANK
15.5%
MASTER'S DEGREE
78.2/ 100
METRIC RATING
148th/ 347
METRIC RANK
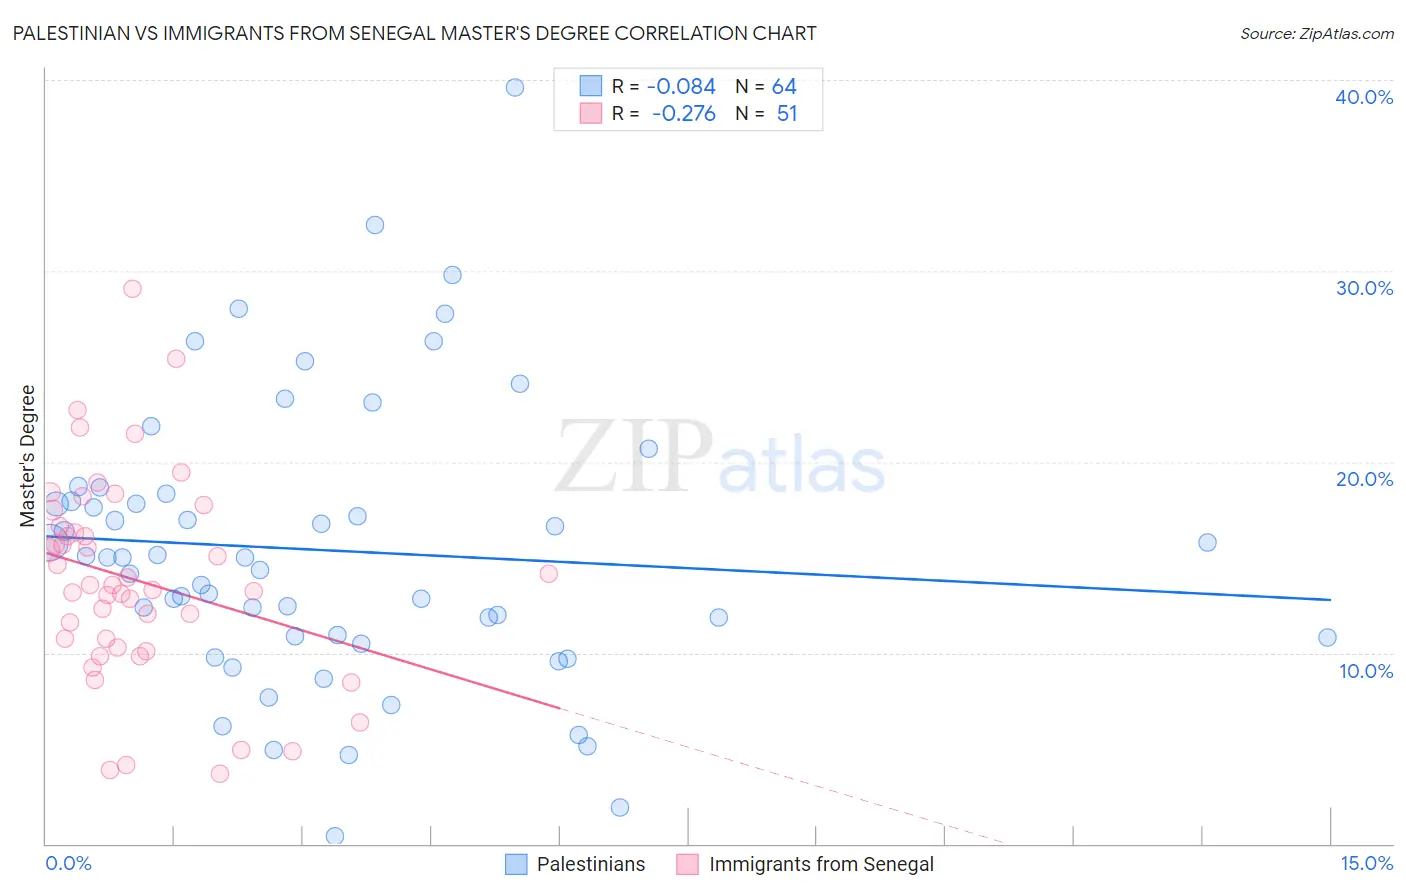
Palestinian vs Immigrants from Senegal Master's Degree Correlation Chart
The statistical analysis conducted on geographies consisting of 216,432,261 people shows a slight negative correlation between the proportion of Palestinians and percentage of population with at least master's degree education in the United States with a correlation coefficient (R) of -0.084 and weighted average of 16.3%. Similarly, the statistical analysis conducted on geographies consisting of 90,124,695 people shows a weak negative correlation between the proportion of Immigrants from Senegal and percentage of population with at least master's degree education in the United States with a correlation coefficient (R) of -0.276 and weighted average of 15.5%, a difference of 5.0%.
Master's Degree Correlation Summary
| Measurement | Palestinian | Immigrants from Senegal |
| Minimum | 0.42% | 3.7% |
| Maximum | 39.6% | 29.1% |
| Range | 39.2% | 25.4% |
| Mean | 15.4% | 13.8% |
| Median | 15.0% | 13.5% |
| Interquartile 25% (IQ1) | 10.8% | 10.3% |
| Interquartile 75% (IQ3) | 18.1% | 16.6% |
| Interquartile Range (IQR) | 7.3% | 6.3% |
| Standard Deviation (Sample) | 7.4% | 5.4% |
| Standard Deviation (Population) | 7.4% | 5.3% |
Similar Demographics by Master's Degree
Demographics Similar to Palestinians by Master's Degree
In terms of master's degree, the demographic groups most similar to Palestinians are Immigrants from Sierra Leone (16.3%, a difference of 0.050%), Immigrants from Eastern Africa (16.3%, a difference of 0.26%), Italian (16.4%, a difference of 0.37%), Immigrants from Eritrea (16.4%, a difference of 0.45%), and Croatian (16.4%, a difference of 0.52%).
| Demographics | Rating | Rank | Master's Degree |
| Lebanese | 96.4 /100 | #120 | Exceptional 16.5% |
| Afghans | 96.2 /100 | #121 | Exceptional 16.5% |
| British | 95.6 /100 | #122 | Exceptional 16.4% |
| Croatians | 95.6 /100 | #123 | Exceptional 16.4% |
| Immigrants | Eritrea | 95.5 /100 | #124 | Exceptional 16.4% |
| Italians | 95.4 /100 | #125 | Exceptional 16.4% |
| Immigrants | Eastern Africa | 95.2 /100 | #126 | Exceptional 16.3% |
| Palestinians | 94.8 /100 | #127 | Exceptional 16.3% |
| Immigrants | Sierra Leone | 94.7 /100 | #128 | Exceptional 16.3% |
| Immigrants | Syria | 93.3 /100 | #129 | Exceptional 16.2% |
| Immigrants | Jordan | 92.7 /100 | #130 | Exceptional 16.1% |
| Taiwanese | 91.9 /100 | #131 | Exceptional 16.1% |
| Serbians | 91.7 /100 | #132 | Exceptional 16.1% |
| Immigrants | Sudan | 90.2 /100 | #133 | Exceptional 16.0% |
| Venezuelans | 88.4 /100 | #134 | Excellent 15.9% |
Demographics Similar to Immigrants from Senegal by Master's Degree
In terms of master's degree, the demographic groups most similar to Immigrants from Senegal are Ghanaian (15.5%, a difference of 0.010%), Slovene (15.5%, a difference of 0.040%), Iraqi (15.5%, a difference of 0.16%), Hungarian (15.6%, a difference of 0.17%), and Immigrants from Afghanistan (15.6%, a difference of 0.21%).
| Demographics | Rating | Rank | Master's Degree |
| Poles | 85.0 /100 | #141 | Excellent 15.7% |
| Immigrants | Africa | 84.0 /100 | #142 | Excellent 15.7% |
| Immigrants | Venezuela | 83.6 /100 | #143 | Excellent 15.7% |
| Canadians | 83.3 /100 | #144 | Excellent 15.7% |
| South Americans | 81.3 /100 | #145 | Excellent 15.6% |
| Immigrants | Afghanistan | 79.4 /100 | #146 | Good 15.6% |
| Hungarians | 79.1 /100 | #147 | Good 15.6% |
| Immigrants | Senegal | 78.2 /100 | #148 | Good 15.5% |
| Ghanaians | 78.2 /100 | #149 | Good 15.5% |
| Slovenes | 78.0 /100 | #150 | Good 15.5% |
| Iraqis | 77.3 /100 | #151 | Good 15.5% |
| Slavs | 77.0 /100 | #152 | Good 15.5% |
| Icelanders | 76.8 /100 | #153 | Good 15.5% |
| Immigrants | South America | 76.3 /100 | #154 | Good 15.5% |
| Immigrants | Bangladesh | 76.1 /100 | #155 | Good 15.5% |