Immigrants from Russia vs Immigrants from Senegal Master's Degree
COMPARE
Immigrants from Russia
Immigrants from Senegal
Master's Degree
Master's Degree Comparison
Immigrants from Russia
Immigrants from Senegal
19.4%
MASTER'S DEGREE
100.0/ 100
METRIC RATING
36th/ 347
METRIC RANK
15.5%
MASTER'S DEGREE
78.2/ 100
METRIC RATING
148th/ 347
METRIC RANK
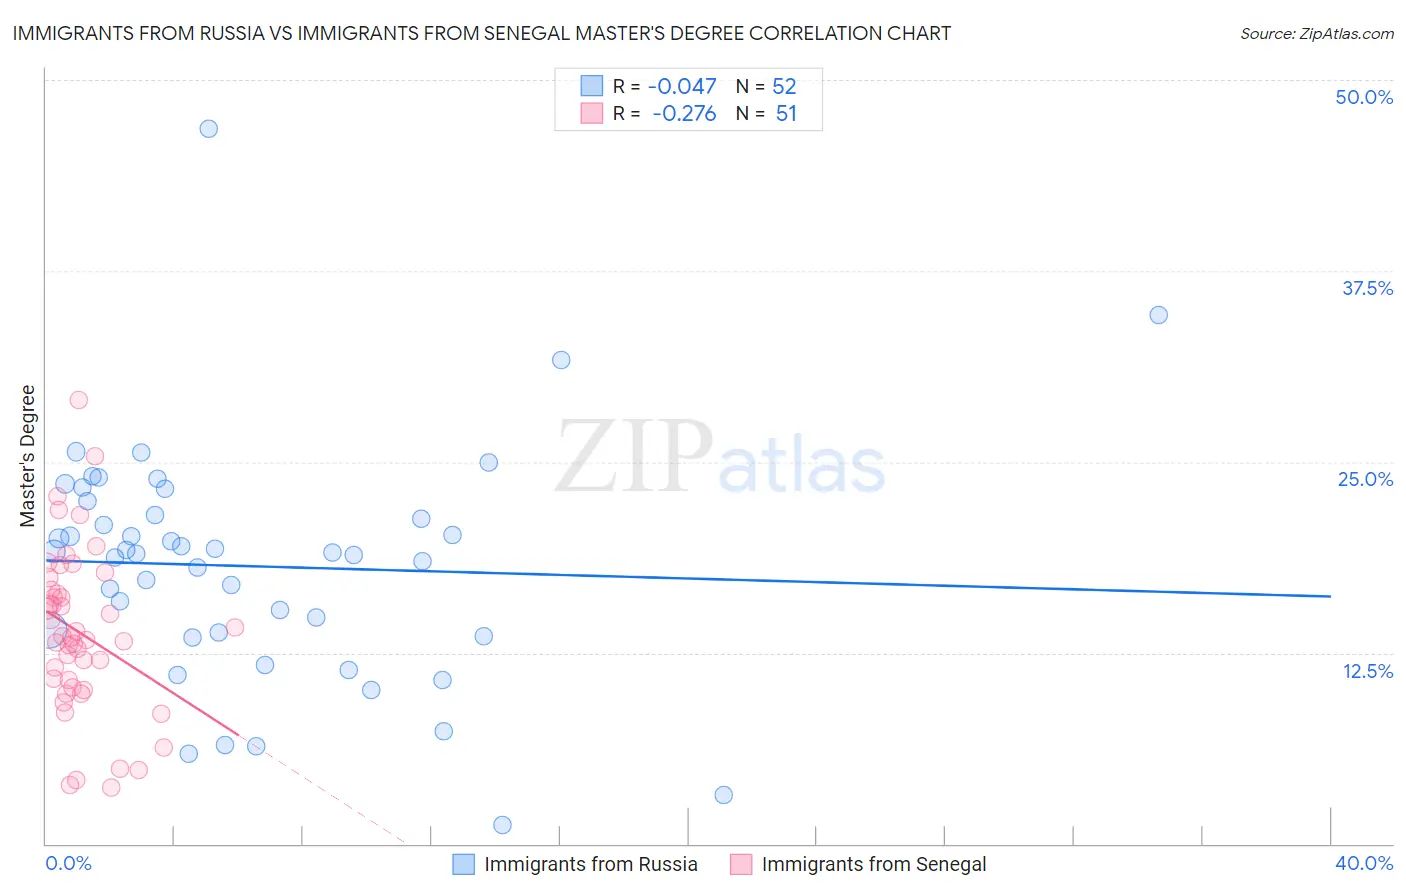
Immigrants from Russia vs Immigrants from Senegal Master's Degree Correlation Chart
The statistical analysis conducted on geographies consisting of 347,838,671 people shows no correlation between the proportion of Immigrants from Russia and percentage of population with at least master's degree education in the United States with a correlation coefficient (R) of -0.047 and weighted average of 19.4%. Similarly, the statistical analysis conducted on geographies consisting of 90,124,695 people shows a weak negative correlation between the proportion of Immigrants from Senegal and percentage of population with at least master's degree education in the United States with a correlation coefficient (R) of -0.276 and weighted average of 15.5%, a difference of 24.9%.
Master's Degree Correlation Summary
| Measurement | Immigrants from Russia | Immigrants from Senegal |
| Minimum | 1.2% | 3.7% |
| Maximum | 46.8% | 29.1% |
| Range | 45.6% | 25.4% |
| Mean | 18.2% | 13.8% |
| Median | 19.0% | 13.5% |
| Interquartile 25% (IQ1) | 13.7% | 10.3% |
| Interquartile 75% (IQ3) | 22.0% | 16.6% |
| Interquartile Range (IQR) | 8.3% | 6.3% |
| Standard Deviation (Sample) | 7.8% | 5.4% |
| Standard Deviation (Population) | 7.7% | 5.3% |
Similar Demographics by Master's Degree
Demographics Similar to Immigrants from Russia by Master's Degree
In terms of master's degree, the demographic groups most similar to Immigrants from Russia are Mongolian (19.4%, a difference of 0.040%), Immigrants from Northern Europe (19.5%, a difference of 0.37%), Immigrants from Denmark (19.5%, a difference of 0.70%), Russian (19.5%, a difference of 0.73%), and Bolivian (19.3%, a difference of 0.73%).
| Demographics | Rating | Rank | Master's Degree |
| Latvians | 100.0 /100 | #29 | Exceptional 19.8% |
| Immigrants | Turkey | 100.0 /100 | #30 | Exceptional 19.7% |
| Immigrants | Korea | 100.0 /100 | #31 | Exceptional 19.7% |
| Burmese | 100.0 /100 | #32 | Exceptional 19.7% |
| Russians | 100.0 /100 | #33 | Exceptional 19.5% |
| Immigrants | Denmark | 100.0 /100 | #34 | Exceptional 19.5% |
| Immigrants | Northern Europe | 100.0 /100 | #35 | Exceptional 19.5% |
| Immigrants | Russia | 100.0 /100 | #36 | Exceptional 19.4% |
| Mongolians | 100.0 /100 | #37 | Exceptional 19.4% |
| Bolivians | 100.0 /100 | #38 | Exceptional 19.3% |
| Immigrants | Spain | 100.0 /100 | #39 | Exceptional 19.1% |
| Immigrants | Bolivia | 100.0 /100 | #40 | Exceptional 19.1% |
| Immigrants | Latvia | 100.0 /100 | #41 | Exceptional 19.1% |
| Immigrants | Saudi Arabia | 100.0 /100 | #42 | Exceptional 19.0% |
| Immigrants | Greece | 100.0 /100 | #43 | Exceptional 19.0% |
Demographics Similar to Immigrants from Senegal by Master's Degree
In terms of master's degree, the demographic groups most similar to Immigrants from Senegal are Ghanaian (15.5%, a difference of 0.010%), Slovene (15.5%, a difference of 0.040%), Iraqi (15.5%, a difference of 0.16%), Hungarian (15.6%, a difference of 0.17%), and Immigrants from Afghanistan (15.6%, a difference of 0.21%).
| Demographics | Rating | Rank | Master's Degree |
| Poles | 85.0 /100 | #141 | Excellent 15.7% |
| Immigrants | Africa | 84.0 /100 | #142 | Excellent 15.7% |
| Immigrants | Venezuela | 83.6 /100 | #143 | Excellent 15.7% |
| Canadians | 83.3 /100 | #144 | Excellent 15.7% |
| South Americans | 81.3 /100 | #145 | Excellent 15.6% |
| Immigrants | Afghanistan | 79.4 /100 | #146 | Good 15.6% |
| Hungarians | 79.1 /100 | #147 | Good 15.6% |
| Immigrants | Senegal | 78.2 /100 | #148 | Good 15.5% |
| Ghanaians | 78.2 /100 | #149 | Good 15.5% |
| Slovenes | 78.0 /100 | #150 | Good 15.5% |
| Iraqis | 77.3 /100 | #151 | Good 15.5% |
| Slavs | 77.0 /100 | #152 | Good 15.5% |
| Icelanders | 76.8 /100 | #153 | Good 15.5% |
| Immigrants | South America | 76.3 /100 | #154 | Good 15.5% |
| Immigrants | Bangladesh | 76.1 /100 | #155 | Good 15.5% |