Yaqui vs Immigrants from Senegal Master's Degree
COMPARE
Yaqui
Immigrants from Senegal
Master's Degree
Master's Degree Comparison
Yaqui
Immigrants from Senegal
11.0%
MASTER'S DEGREE
0.0/ 100
METRIC RATING
313th/ 347
METRIC RANK
15.5%
MASTER'S DEGREE
78.2/ 100
METRIC RATING
148th/ 347
METRIC RANK
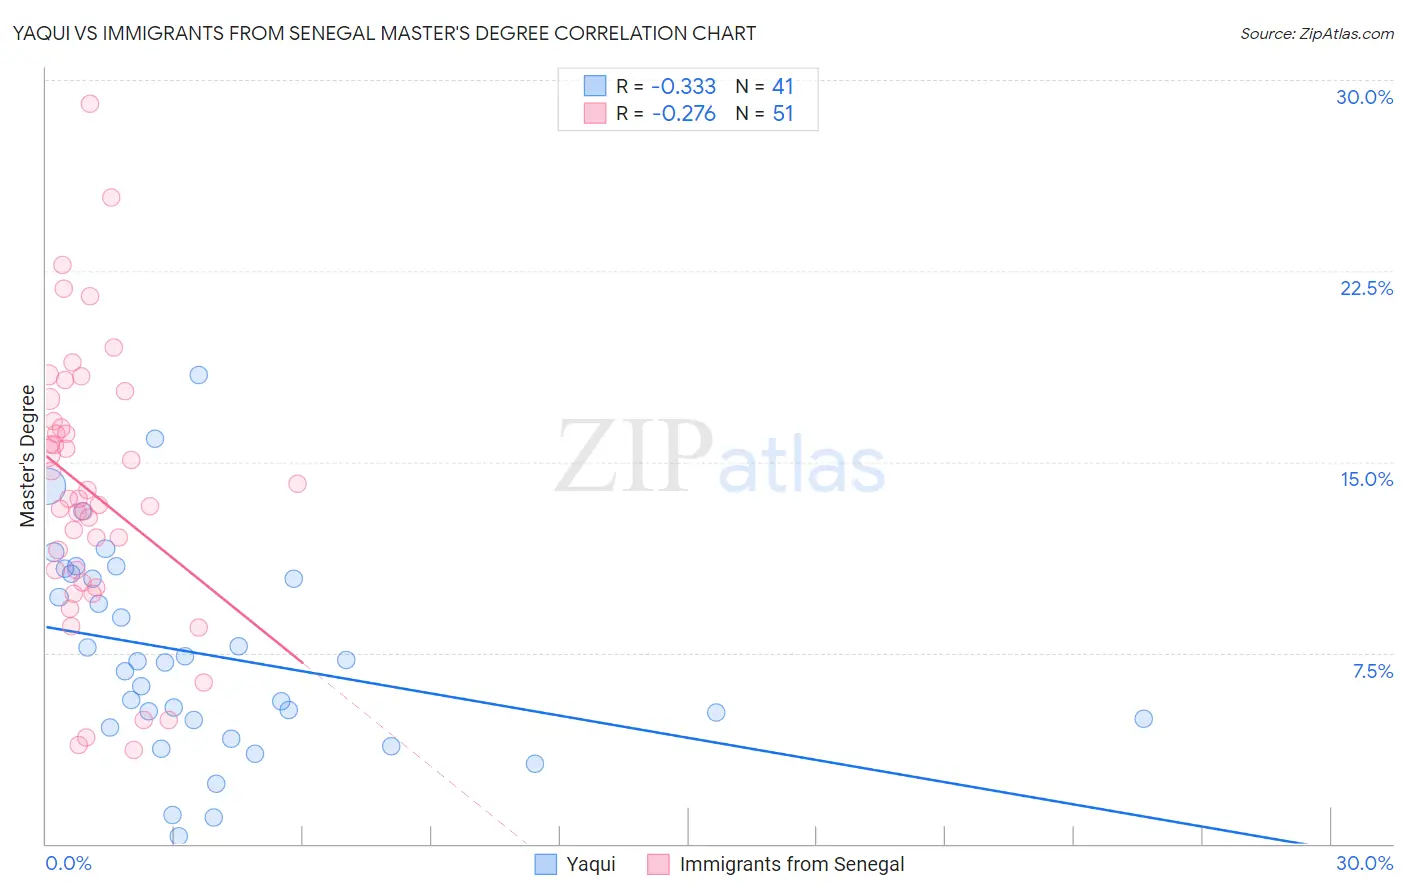
Yaqui vs Immigrants from Senegal Master's Degree Correlation Chart
The statistical analysis conducted on geographies consisting of 107,722,920 people shows a mild negative correlation between the proportion of Yaqui and percentage of population with at least master's degree education in the United States with a correlation coefficient (R) of -0.333 and weighted average of 11.0%. Similarly, the statistical analysis conducted on geographies consisting of 90,124,695 people shows a weak negative correlation between the proportion of Immigrants from Senegal and percentage of population with at least master's degree education in the United States with a correlation coefficient (R) of -0.276 and weighted average of 15.5%, a difference of 41.0%.
Master's Degree Correlation Summary
| Measurement | Yaqui | Immigrants from Senegal |
| Minimum | 0.29% | 3.7% |
| Maximum | 18.4% | 29.1% |
| Range | 18.1% | 25.4% |
| Mean | 7.4% | 13.8% |
| Median | 7.1% | 13.5% |
| Interquartile 25% (IQ1) | 4.7% | 10.3% |
| Interquartile 75% (IQ3) | 10.5% | 16.6% |
| Interquartile Range (IQR) | 5.8% | 6.3% |
| Standard Deviation (Sample) | 4.0% | 5.4% |
| Standard Deviation (Population) | 4.0% | 5.3% |
Similar Demographics by Master's Degree
Demographics Similar to Yaqui by Master's Degree
In terms of master's degree, the demographic groups most similar to Yaqui are Choctaw (11.0%, a difference of 0.18%), Seminole (11.0%, a difference of 0.27%), Cajun (11.0%, a difference of 0.40%), Apache (11.0%, a difference of 0.40%), and Hispanic or Latino (10.9%, a difference of 0.74%).
| Demographics | Rating | Rank | Master's Degree |
| Mexican American Indians | 0.0 /100 | #306 | Tragic 11.2% |
| Cheyenne | 0.0 /100 | #307 | Tragic 11.2% |
| Puerto Ricans | 0.0 /100 | #308 | Tragic 11.2% |
| Puget Sound Salish | 0.0 /100 | #309 | Tragic 11.1% |
| Shoshone | 0.0 /100 | #310 | Tragic 11.1% |
| Seminole | 0.0 /100 | #311 | Tragic 11.0% |
| Choctaw | 0.0 /100 | #312 | Tragic 11.0% |
| Yaqui | 0.0 /100 | #313 | Tragic 11.0% |
| Cajuns | 0.0 /100 | #314 | Tragic 11.0% |
| Apache | 0.0 /100 | #315 | Tragic 11.0% |
| Hispanics or Latinos | 0.0 /100 | #316 | Tragic 10.9% |
| Hopi | 0.0 /100 | #317 | Tragic 10.9% |
| Immigrants | Cuba | 0.0 /100 | #318 | Tragic 10.9% |
| Kiowa | 0.0 /100 | #319 | Tragic 10.8% |
| Immigrants | Micronesia | 0.0 /100 | #320 | Tragic 10.8% |
Demographics Similar to Immigrants from Senegal by Master's Degree
In terms of master's degree, the demographic groups most similar to Immigrants from Senegal are Ghanaian (15.5%, a difference of 0.010%), Slovene (15.5%, a difference of 0.040%), Iraqi (15.5%, a difference of 0.16%), Hungarian (15.6%, a difference of 0.17%), and Immigrants from Afghanistan (15.6%, a difference of 0.21%).
| Demographics | Rating | Rank | Master's Degree |
| Poles | 85.0 /100 | #141 | Excellent 15.7% |
| Immigrants | Africa | 84.0 /100 | #142 | Excellent 15.7% |
| Immigrants | Venezuela | 83.6 /100 | #143 | Excellent 15.7% |
| Canadians | 83.3 /100 | #144 | Excellent 15.7% |
| South Americans | 81.3 /100 | #145 | Excellent 15.6% |
| Immigrants | Afghanistan | 79.4 /100 | #146 | Good 15.6% |
| Hungarians | 79.1 /100 | #147 | Good 15.6% |
| Immigrants | Senegal | 78.2 /100 | #148 | Good 15.5% |
| Ghanaians | 78.2 /100 | #149 | Good 15.5% |
| Slovenes | 78.0 /100 | #150 | Good 15.5% |
| Iraqis | 77.3 /100 | #151 | Good 15.5% |
| Slavs | 77.0 /100 | #152 | Good 15.5% |
| Icelanders | 76.8 /100 | #153 | Good 15.5% |
| Immigrants | South America | 76.3 /100 | #154 | Good 15.5% |
| Immigrants | Bangladesh | 76.1 /100 | #155 | Good 15.5% |