Arapaho vs Immigrants from Uzbekistan College, 1 year or more
COMPARE
Arapaho
Immigrants from Uzbekistan
College, 1 year or more
College, 1 year or more Comparison
Arapaho
Immigrants from Uzbekistan
54.1%
COLLEGE, 1 YEAR OR MORE
0.1/ 100
METRIC RATING
279th/ 347
METRIC RANK
61.0%
COLLEGE, 1 YEAR OR MORE
88.0/ 100
METRIC RATING
133rd/ 347
METRIC RANK
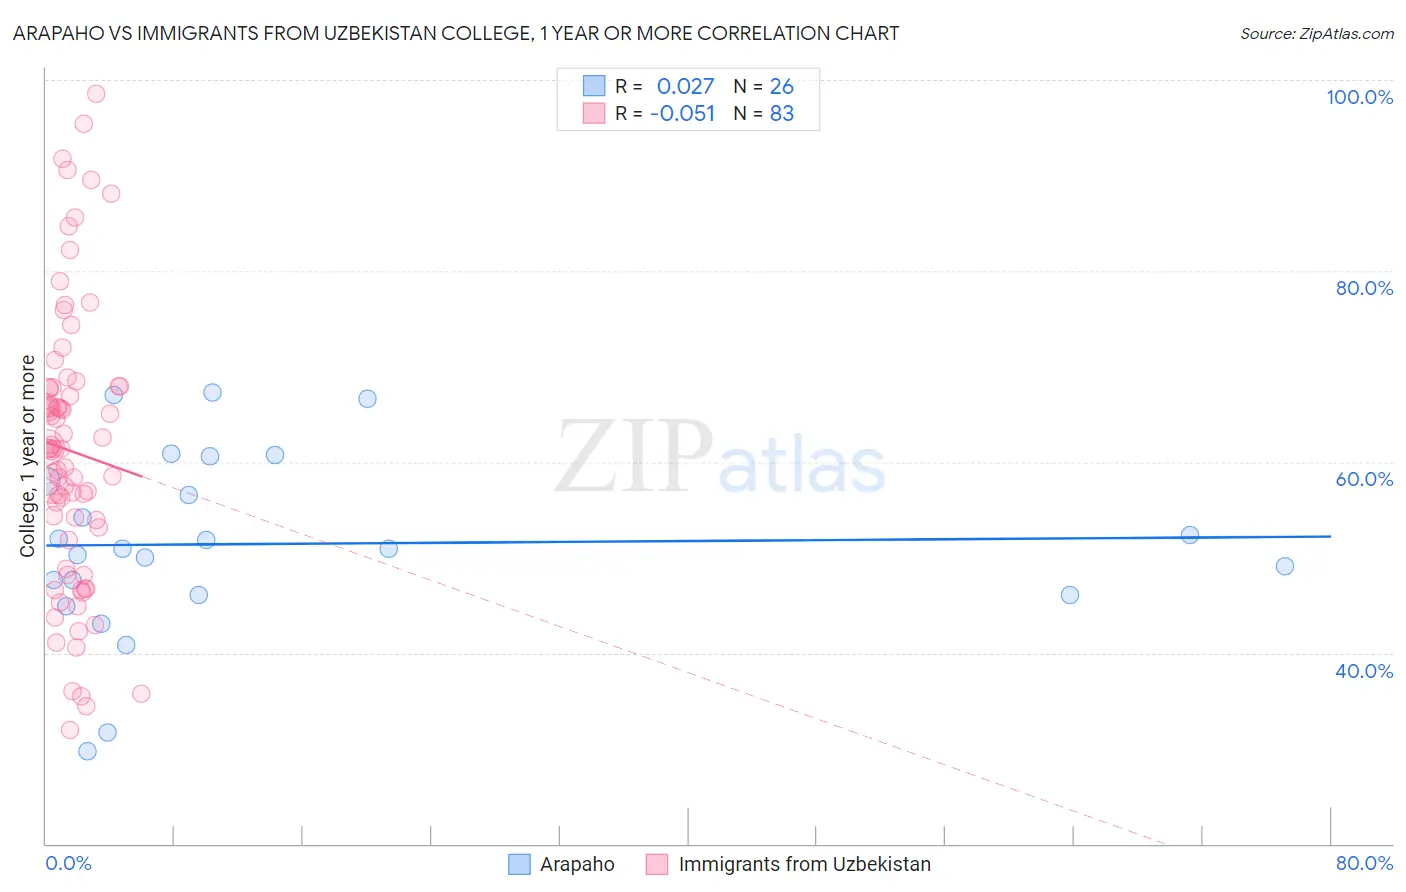
Arapaho vs Immigrants from Uzbekistan College, 1 year or more Correlation Chart
The statistical analysis conducted on geographies consisting of 29,780,040 people shows no correlation between the proportion of Arapaho and percentage of population with at least college, 1 year or more education in the United States with a correlation coefficient (R) of 0.027 and weighted average of 54.1%. Similarly, the statistical analysis conducted on geographies consisting of 118,765,305 people shows a slight negative correlation between the proportion of Immigrants from Uzbekistan and percentage of population with at least college, 1 year or more education in the United States with a correlation coefficient (R) of -0.051 and weighted average of 61.0%, a difference of 12.6%.
College, 1 year or more Correlation Summary
| Measurement | Arapaho | Immigrants from Uzbekistan |
| Minimum | 29.7% | 31.9% |
| Maximum | 67.3% | 98.6% |
| Range | 37.6% | 66.7% |
| Mean | 51.4% | 61.1% |
| Median | 50.9% | 61.4% |
| Interquartile 25% (IQ1) | 46.1% | 51.9% |
| Interquartile 75% (IQ3) | 58.0% | 67.8% |
| Interquartile Range (IQR) | 11.9% | 15.9% |
| Standard Deviation (Sample) | 9.5% | 14.6% |
| Standard Deviation (Population) | 9.3% | 14.5% |
Similar Demographics by College, 1 year or more
Demographics Similar to Arapaho by College, 1 year or more
In terms of college, 1 year or more, the demographic groups most similar to Arapaho are Immigrants from Jamaica (54.2%, a difference of 0.020%), Cheyenne (54.1%, a difference of 0.060%), Colville (54.1%, a difference of 0.070%), Guyanese (54.1%, a difference of 0.11%), and Ecuadorian (54.3%, a difference of 0.34%).
| Demographics | Rating | Rank | College, 1 year or more |
| Comanche | 0.2 /100 | #272 | Tragic 54.4% |
| Immigrants | Grenada | 0.2 /100 | #273 | Tragic 54.4% |
| Belizeans | 0.2 /100 | #274 | Tragic 54.4% |
| Americans | 0.2 /100 | #275 | Tragic 54.4% |
| Shoshone | 0.2 /100 | #276 | Tragic 54.3% |
| Ecuadorians | 0.2 /100 | #277 | Tragic 54.3% |
| Immigrants | Jamaica | 0.1 /100 | #278 | Tragic 54.2% |
| Arapaho | 0.1 /100 | #279 | Tragic 54.1% |
| Cheyenne | 0.1 /100 | #280 | Tragic 54.1% |
| Colville | 0.1 /100 | #281 | Tragic 54.1% |
| Guyanese | 0.1 /100 | #282 | Tragic 54.1% |
| Nicaraguans | 0.1 /100 | #283 | Tragic 53.9% |
| Ute | 0.1 /100 | #284 | Tragic 53.8% |
| Immigrants | Guyana | 0.1 /100 | #285 | Tragic 53.5% |
| Central American Indians | 0.1 /100 | #286 | Tragic 53.5% |
Demographics Similar to Immigrants from Uzbekistan by College, 1 year or more
In terms of college, 1 year or more, the demographic groups most similar to Immigrants from Uzbekistan are Immigrants from Venezuela (61.0%, a difference of 0.010%), Scandinavian (61.0%, a difference of 0.030%), Immigrants from Uganda (60.9%, a difference of 0.070%), Basque (60.9%, a difference of 0.090%), and Slovene (60.9%, a difference of 0.18%).
| Demographics | Rating | Rank | College, 1 year or more |
| Alsatians | 91.3 /100 | #126 | Exceptional 61.3% |
| Immigrants | Eastern Africa | 91.1 /100 | #127 | Exceptional 61.2% |
| Immigrants | Italy | 91.1 /100 | #128 | Exceptional 61.2% |
| Ugandans | 90.7 /100 | #129 | Exceptional 61.2% |
| Italians | 89.5 /100 | #130 | Excellent 61.1% |
| Immigrants | Morocco | 89.5 /100 | #131 | Excellent 61.1% |
| Scandinavians | 88.2 /100 | #132 | Excellent 61.0% |
| Immigrants | Uzbekistan | 88.0 /100 | #133 | Excellent 61.0% |
| Immigrants | Venezuela | 87.9 /100 | #134 | Excellent 61.0% |
| Immigrants | Uganda | 87.4 /100 | #135 | Excellent 60.9% |
| Basques | 87.2 /100 | #136 | Excellent 60.9% |
| Slovenes | 86.5 /100 | #137 | Excellent 60.9% |
| Taiwanese | 84.3 /100 | #138 | Excellent 60.7% |
| Immigrants | Eritrea | 84.3 /100 | #139 | Excellent 60.7% |
| Iraqis | 83.3 /100 | #140 | Excellent 60.7% |