Arapaho vs Iranian College, 1 year or more
COMPARE
Arapaho
Iranian
College, 1 year or more
College, 1 year or more Comparison
Arapaho
Iranians
54.1%
COLLEGE, 1 YEAR OR MORE
0.1/ 100
METRIC RATING
279th/ 347
METRIC RANK
70.0%
COLLEGE, 1 YEAR OR MORE
100.0/ 100
METRIC RATING
3rd/ 347
METRIC RANK
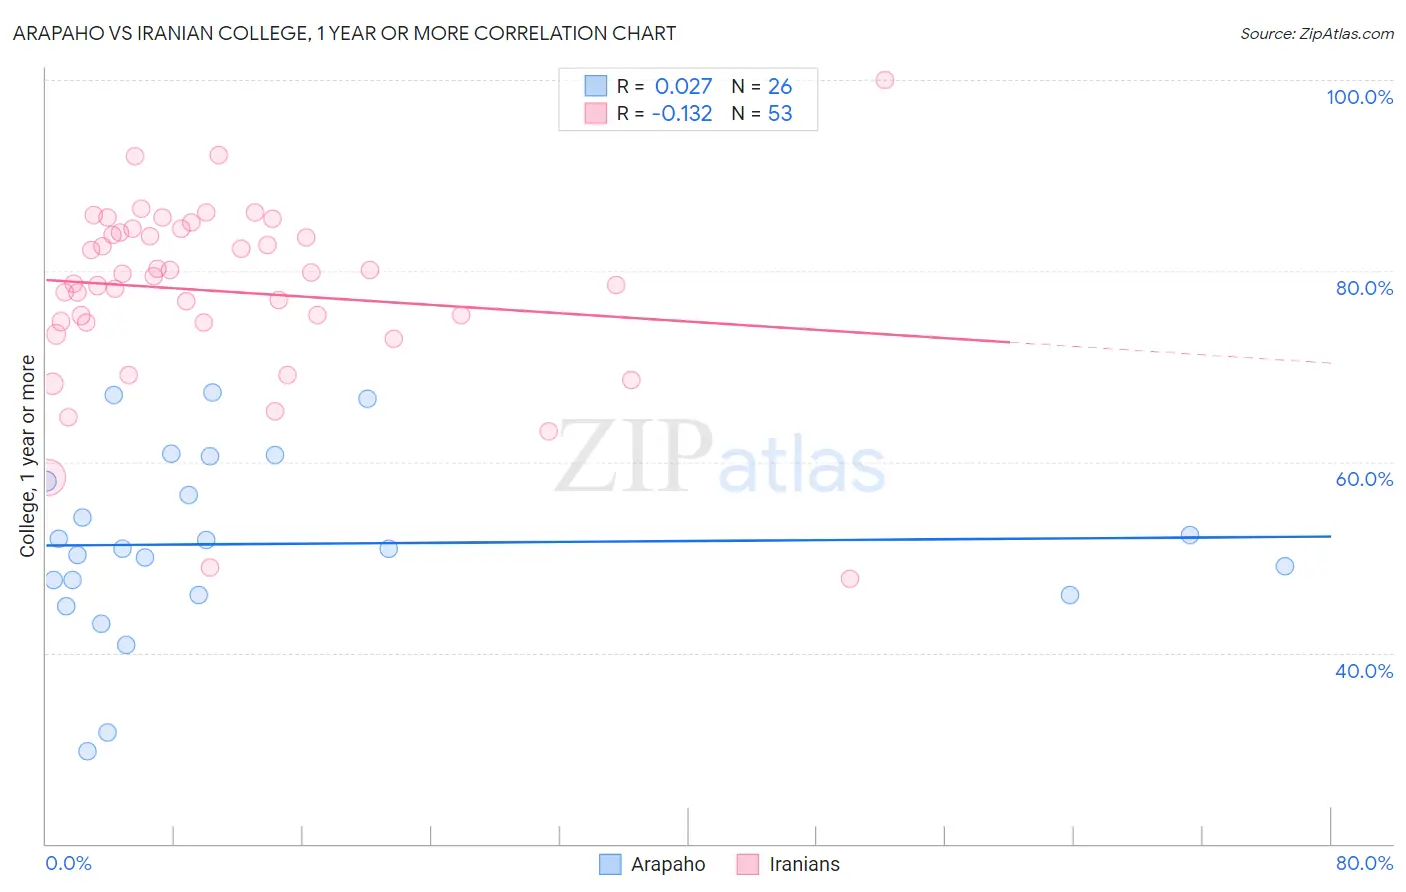
Arapaho vs Iranian College, 1 year or more Correlation Chart
The statistical analysis conducted on geographies consisting of 29,780,040 people shows no correlation between the proportion of Arapaho and percentage of population with at least college, 1 year or more education in the United States with a correlation coefficient (R) of 0.027 and weighted average of 54.1%. Similarly, the statistical analysis conducted on geographies consisting of 316,900,663 people shows a poor negative correlation between the proportion of Iranians and percentage of population with at least college, 1 year or more education in the United States with a correlation coefficient (R) of -0.132 and weighted average of 70.0%, a difference of 29.2%.
College, 1 year or more Correlation Summary
| Measurement | Arapaho | Iranian |
| Minimum | 29.7% | 47.7% |
| Maximum | 67.3% | 100.0% |
| Range | 37.6% | 52.3% |
| Mean | 51.4% | 77.8% |
| Median | 50.9% | 79.4% |
| Interquartile 25% (IQ1) | 46.1% | 74.6% |
| Interquartile 75% (IQ3) | 58.0% | 84.2% |
| Interquartile Range (IQR) | 11.9% | 9.7% |
| Standard Deviation (Sample) | 9.5% | 9.6% |
| Standard Deviation (Population) | 9.3% | 9.6% |
Similar Demographics by College, 1 year or more
Demographics Similar to Arapaho by College, 1 year or more
In terms of college, 1 year or more, the demographic groups most similar to Arapaho are Immigrants from Jamaica (54.2%, a difference of 0.020%), Cheyenne (54.1%, a difference of 0.060%), Colville (54.1%, a difference of 0.070%), Guyanese (54.1%, a difference of 0.11%), and Ecuadorian (54.3%, a difference of 0.34%).
| Demographics | Rating | Rank | College, 1 year or more |
| Comanche | 0.2 /100 | #272 | Tragic 54.4% |
| Immigrants | Grenada | 0.2 /100 | #273 | Tragic 54.4% |
| Belizeans | 0.2 /100 | #274 | Tragic 54.4% |
| Americans | 0.2 /100 | #275 | Tragic 54.4% |
| Shoshone | 0.2 /100 | #276 | Tragic 54.3% |
| Ecuadorians | 0.2 /100 | #277 | Tragic 54.3% |
| Immigrants | Jamaica | 0.1 /100 | #278 | Tragic 54.2% |
| Arapaho | 0.1 /100 | #279 | Tragic 54.1% |
| Cheyenne | 0.1 /100 | #280 | Tragic 54.1% |
| Colville | 0.1 /100 | #281 | Tragic 54.1% |
| Guyanese | 0.1 /100 | #282 | Tragic 54.1% |
| Nicaraguans | 0.1 /100 | #283 | Tragic 53.9% |
| Ute | 0.1 /100 | #284 | Tragic 53.8% |
| Immigrants | Guyana | 0.1 /100 | #285 | Tragic 53.5% |
| Central American Indians | 0.1 /100 | #286 | Tragic 53.5% |
Demographics Similar to Iranians by College, 1 year or more
In terms of college, 1 year or more, the demographic groups most similar to Iranians are Immigrants from Singapore (70.1%, a difference of 0.22%), Immigrants from Taiwan (69.6%, a difference of 0.49%), Immigrants from India (69.6%, a difference of 0.49%), Immigrants from Iran (69.5%, a difference of 0.70%), and Filipino (71.0%, a difference of 1.4%).
| Demographics | Rating | Rank | College, 1 year or more |
| Filipinos | 100.0 /100 | #1 | Exceptional 71.0% |
| Immigrants | Singapore | 100.0 /100 | #2 | Exceptional 70.1% |
| Iranians | 100.0 /100 | #3 | Exceptional 70.0% |
| Immigrants | Taiwan | 100.0 /100 | #4 | Exceptional 69.6% |
| Immigrants | India | 100.0 /100 | #5 | Exceptional 69.6% |
| Immigrants | Iran | 100.0 /100 | #6 | Exceptional 69.5% |
| Okinawans | 100.0 /100 | #7 | Exceptional 69.0% |
| Thais | 100.0 /100 | #8 | Exceptional 68.6% |
| Immigrants | Israel | 100.0 /100 | #9 | Exceptional 67.8% |
| Immigrants | Australia | 100.0 /100 | #10 | Exceptional 67.7% |
| Immigrants | South Central Asia | 100.0 /100 | #11 | Exceptional 67.1% |
| Cypriots | 100.0 /100 | #12 | Exceptional 67.0% |
| Immigrants | Sweden | 100.0 /100 | #13 | Exceptional 66.8% |
| Burmese | 100.0 /100 | #14 | Exceptional 66.7% |
| Cambodians | 100.0 /100 | #15 | Exceptional 66.7% |