Arapaho vs Swiss College, 1 year or more
COMPARE
Arapaho
Swiss
College, 1 year or more
College, 1 year or more Comparison
Arapaho
Swiss
54.1%
COLLEGE, 1 YEAR OR MORE
0.1/ 100
METRIC RATING
279th/ 347
METRIC RANK
59.2%
COLLEGE, 1 YEAR OR MORE
43.4/ 100
METRIC RATING
181st/ 347
METRIC RANK
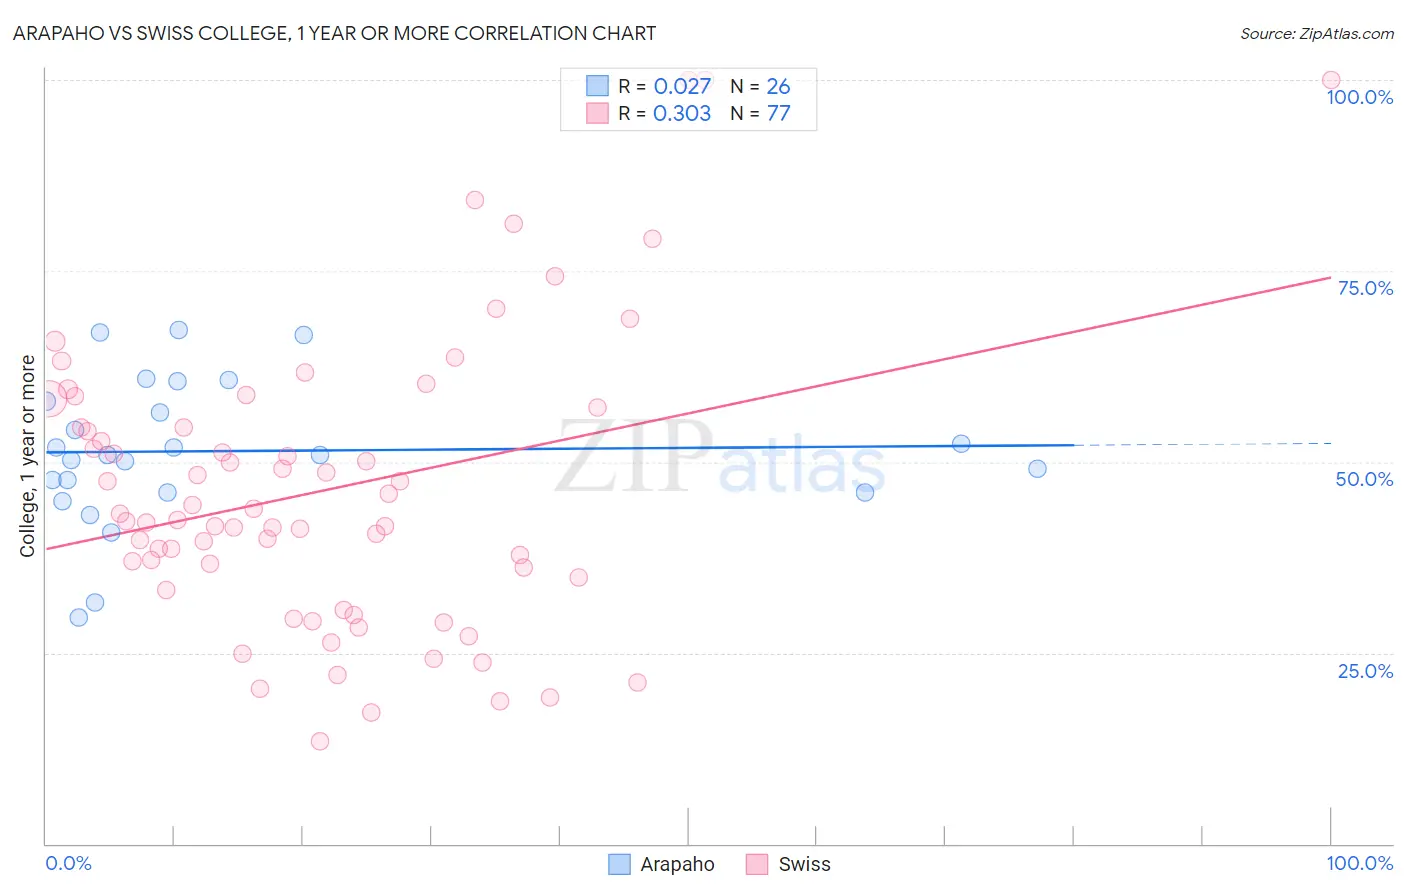
Arapaho vs Swiss College, 1 year or more Correlation Chart
The statistical analysis conducted on geographies consisting of 29,780,040 people shows no correlation between the proportion of Arapaho and percentage of population with at least college, 1 year or more education in the United States with a correlation coefficient (R) of 0.027 and weighted average of 54.1%. Similarly, the statistical analysis conducted on geographies consisting of 465,017,348 people shows a mild positive correlation between the proportion of Swiss and percentage of population with at least college, 1 year or more education in the United States with a correlation coefficient (R) of 0.303 and weighted average of 59.2%, a difference of 9.3%.
College, 1 year or more Correlation Summary
| Measurement | Arapaho | Swiss |
| Minimum | 29.7% | 13.4% |
| Maximum | 67.3% | 100.0% |
| Range | 37.6% | 86.6% |
| Mean | 51.4% | 46.3% |
| Median | 50.9% | 42.4% |
| Interquartile 25% (IQ1) | 46.1% | 34.1% |
| Interquartile 75% (IQ3) | 58.0% | 55.8% |
| Interquartile Range (IQR) | 11.9% | 21.7% |
| Standard Deviation (Sample) | 9.5% | 18.9% |
| Standard Deviation (Population) | 9.3% | 18.8% |
Similar Demographics by College, 1 year or more
Demographics Similar to Arapaho by College, 1 year or more
In terms of college, 1 year or more, the demographic groups most similar to Arapaho are Immigrants from Jamaica (54.2%, a difference of 0.020%), Cheyenne (54.1%, a difference of 0.060%), Colville (54.1%, a difference of 0.070%), Guyanese (54.1%, a difference of 0.11%), and Ecuadorian (54.3%, a difference of 0.34%).
| Demographics | Rating | Rank | College, 1 year or more |
| Comanche | 0.2 /100 | #272 | Tragic 54.4% |
| Immigrants | Grenada | 0.2 /100 | #273 | Tragic 54.4% |
| Belizeans | 0.2 /100 | #274 | Tragic 54.4% |
| Americans | 0.2 /100 | #275 | Tragic 54.4% |
| Shoshone | 0.2 /100 | #276 | Tragic 54.3% |
| Ecuadorians | 0.2 /100 | #277 | Tragic 54.3% |
| Immigrants | Jamaica | 0.1 /100 | #278 | Tragic 54.2% |
| Arapaho | 0.1 /100 | #279 | Tragic 54.1% |
| Cheyenne | 0.1 /100 | #280 | Tragic 54.1% |
| Colville | 0.1 /100 | #281 | Tragic 54.1% |
| Guyanese | 0.1 /100 | #282 | Tragic 54.1% |
| Nicaraguans | 0.1 /100 | #283 | Tragic 53.9% |
| Ute | 0.1 /100 | #284 | Tragic 53.8% |
| Immigrants | Guyana | 0.1 /100 | #285 | Tragic 53.5% |
| Central American Indians | 0.1 /100 | #286 | Tragic 53.5% |
Demographics Similar to Swiss by College, 1 year or more
In terms of college, 1 year or more, the demographic groups most similar to Swiss are Immigrants from Bosnia and Herzegovina (59.2%, a difference of 0.030%), Yugoslavian (59.2%, a difference of 0.040%), Bermudan (59.3%, a difference of 0.17%), German Russian (59.1%, a difference of 0.22%), and Tlingit-Haida (59.4%, a difference of 0.27%).
| Demographics | Rating | Rank | College, 1 year or more |
| Celtics | 50.0 /100 | #174 | Average 59.4% |
| Sri Lankans | 49.0 /100 | #175 | Average 59.4% |
| Immigrants | Poland | 48.9 /100 | #176 | Average 59.4% |
| Tlingit-Haida | 48.4 /100 | #177 | Average 59.4% |
| Czechoslovakians | 48.3 /100 | #178 | Average 59.4% |
| Bermudans | 46.6 /100 | #179 | Average 59.3% |
| Yugoslavians | 44.1 /100 | #180 | Average 59.2% |
| Swiss | 43.4 /100 | #181 | Average 59.2% |
| Immigrants | Bosnia and Herzegovina | 42.8 /100 | #182 | Average 59.2% |
| German Russians | 39.3 /100 | #183 | Fair 59.1% |
| Spaniards | 38.3 /100 | #184 | Fair 59.0% |
| South Americans | 35.9 /100 | #185 | Fair 59.0% |
| Scotch-Irish | 34.7 /100 | #186 | Fair 58.9% |
| Germans | 34.7 /100 | #187 | Fair 58.9% |
| French | 34.4 /100 | #188 | Fair 58.9% |