Arapaho vs Immigrants from Uzbekistan Child Poverty Among Girls Under 16
COMPARE
Arapaho
Immigrants from Uzbekistan
Child Poverty Among Girls Under 16
Child Poverty Among Girls Under 16 Comparison
Arapaho
Immigrants from Uzbekistan
21.7%
CHILD POVERTY AMONG GIRLS UNDER 16
0.0/ 100
METRIC RATING
314th/ 347
METRIC RANK
17.1%
CHILD POVERTY AMONG GIRLS UNDER 16
21.5/ 100
METRIC RATING
200th/ 347
METRIC RANK
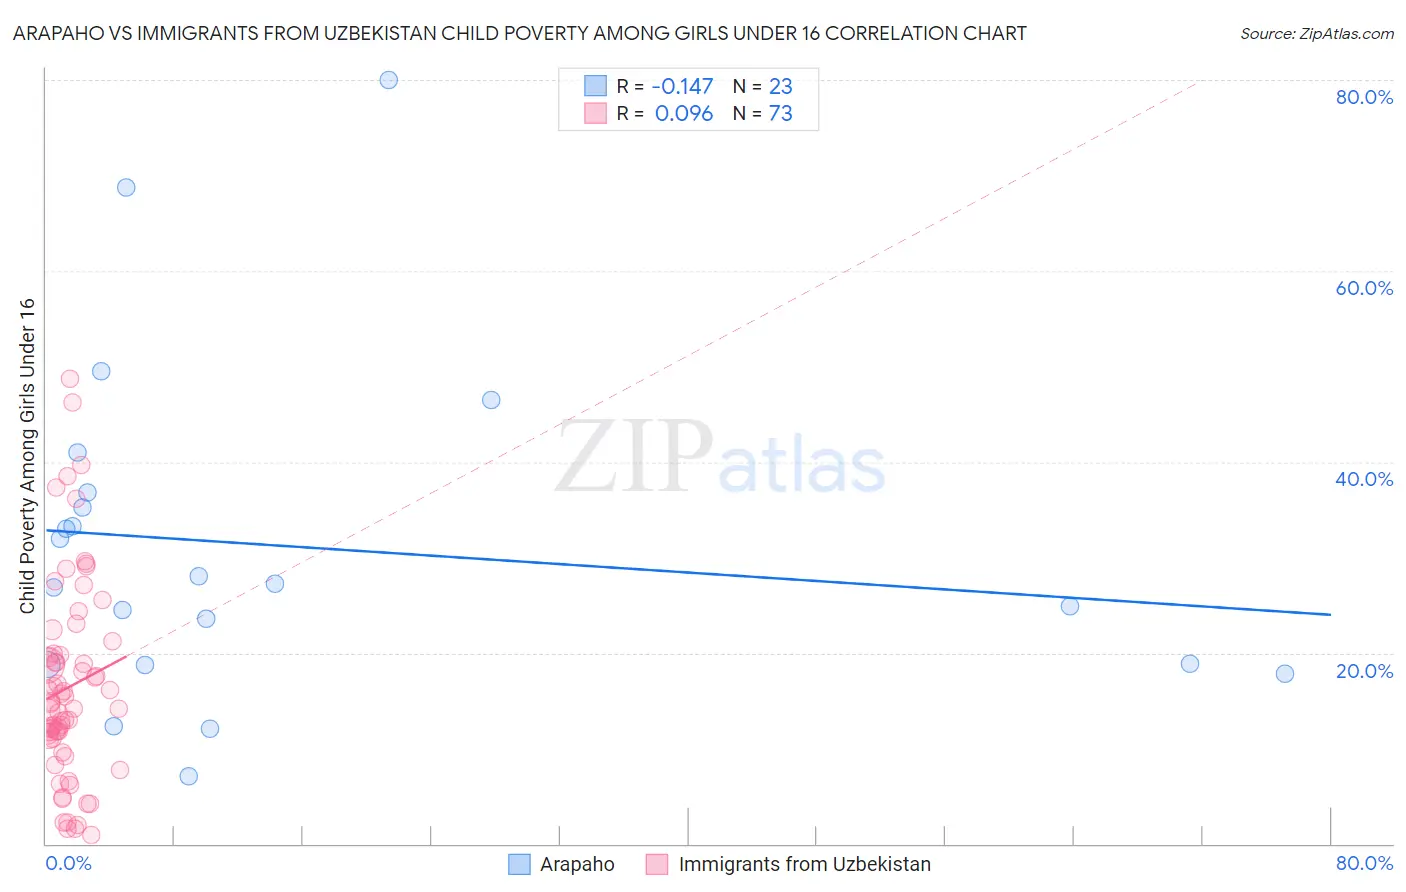
Arapaho vs Immigrants from Uzbekistan Child Poverty Among Girls Under 16 Correlation Chart
The statistical analysis conducted on geographies consisting of 29,689,796 people shows a poor negative correlation between the proportion of Arapaho and poverty level among girls under the age of 16 in the United States with a correlation coefficient (R) of -0.147 and weighted average of 21.7%. Similarly, the statistical analysis conducted on geographies consisting of 117,883,123 people shows a slight positive correlation between the proportion of Immigrants from Uzbekistan and poverty level among girls under the age of 16 in the United States with a correlation coefficient (R) of 0.096 and weighted average of 17.1%, a difference of 27.3%.
Child Poverty Among Girls Under 16 Correlation Summary
| Measurement | Arapaho | Immigrants from Uzbekistan |
| Minimum | 7.0% | 0.85% |
| Maximum | 80.0% | 48.6% |
| Range | 73.0% | 47.8% |
| Mean | 31.1% | 16.4% |
| Median | 27.3% | 14.1% |
| Interquartile 25% (IQ1) | 18.8% | 10.9% |
| Interquartile 75% (IQ3) | 36.8% | 19.8% |
| Interquartile Range (IQR) | 18.0% | 8.9% |
| Standard Deviation (Sample) | 17.4% | 10.4% |
| Standard Deviation (Population) | 17.0% | 10.3% |
Similar Demographics by Child Poverty Among Girls Under 16
Demographics Similar to Arapaho by Child Poverty Among Girls Under 16
In terms of child poverty among girls under 16, the demographic groups most similar to Arapaho are Creek (21.7%, a difference of 0.010%), Ute (21.8%, a difference of 0.28%), Immigrants from Mexico (21.6%, a difference of 0.51%), Immigrants from Guatemala (21.9%, a difference of 0.55%), and Dutch West Indian (21.6%, a difference of 0.75%).
| Demographics | Rating | Rank | Child Poverty Among Girls Under 16 |
| Immigrants | Bahamas | 0.0 /100 | #307 | Tragic 21.4% |
| Houma | 0.0 /100 | #308 | Tragic 21.5% |
| Bahamians | 0.0 /100 | #309 | Tragic 21.5% |
| Immigrants | Somalia | 0.0 /100 | #310 | Tragic 21.6% |
| Dutch West Indians | 0.0 /100 | #311 | Tragic 21.6% |
| Immigrants | Mexico | 0.0 /100 | #312 | Tragic 21.6% |
| Creek | 0.0 /100 | #313 | Tragic 21.7% |
| Arapaho | 0.0 /100 | #314 | Tragic 21.7% |
| Ute | 0.0 /100 | #315 | Tragic 21.8% |
| Immigrants | Guatemala | 0.0 /100 | #316 | Tragic 21.9% |
| Africans | 0.0 /100 | #317 | Tragic 21.9% |
| Immigrants | Dominica | 0.0 /100 | #318 | Tragic 22.1% |
| U.S. Virgin Islanders | 0.0 /100 | #319 | Tragic 22.1% |
| Hondurans | 0.0 /100 | #320 | Tragic 22.2% |
| Colville | 0.0 /100 | #321 | Tragic 22.5% |
Demographics Similar to Immigrants from Uzbekistan by Child Poverty Among Girls Under 16
In terms of child poverty among girls under 16, the demographic groups most similar to Immigrants from Uzbekistan are Immigrants from Afghanistan (17.1%, a difference of 0.16%), Immigrants from Lebanon (17.1%, a difference of 0.18%), Spaniard (17.0%, a difference of 0.53%), Celtic (17.0%, a difference of 0.59%), and Immigrants from Costa Rica (17.0%, a difference of 0.64%).
| Demographics | Rating | Rank | Child Poverty Among Girls Under 16 |
| Aleuts | 28.7 /100 | #193 | Fair 16.9% |
| Spanish | 28.6 /100 | #194 | Fair 16.9% |
| Immigrants | Costa Rica | 25.6 /100 | #195 | Fair 17.0% |
| Celtics | 25.2 /100 | #196 | Fair 17.0% |
| Spaniards | 24.9 /100 | #197 | Fair 17.0% |
| Immigrants | Lebanon | 22.6 /100 | #198 | Fair 17.1% |
| Immigrants | Afghanistan | 22.4 /100 | #199 | Fair 17.1% |
| Immigrants | Uzbekistan | 21.5 /100 | #200 | Fair 17.1% |
| Immigrants | Kenya | 17.8 /100 | #201 | Poor 17.2% |
| Immigrants | Sierra Leone | 17.6 /100 | #202 | Poor 17.2% |
| Ugandans | 17.5 /100 | #203 | Poor 17.2% |
| Iraqis | 13.0 /100 | #204 | Poor 17.4% |
| Immigrants | Cameroon | 12.6 /100 | #205 | Poor 17.4% |
| Delaware | 11.5 /100 | #206 | Poor 17.4% |
| Hmong | 10.6 /100 | #207 | Poor 17.5% |