Arapaho vs Immigrants from Dominica College, 1 year or more
COMPARE
Arapaho
Immigrants from Dominica
College, 1 year or more
College, 1 year or more Comparison
Arapaho
Immigrants from Dominica
54.1%
COLLEGE, 1 YEAR OR MORE
0.1/ 100
METRIC RATING
279th/ 347
METRIC RANK
52.5%
COLLEGE, 1 YEAR OR MORE
0.0/ 100
METRIC RATING
298th/ 347
METRIC RANK
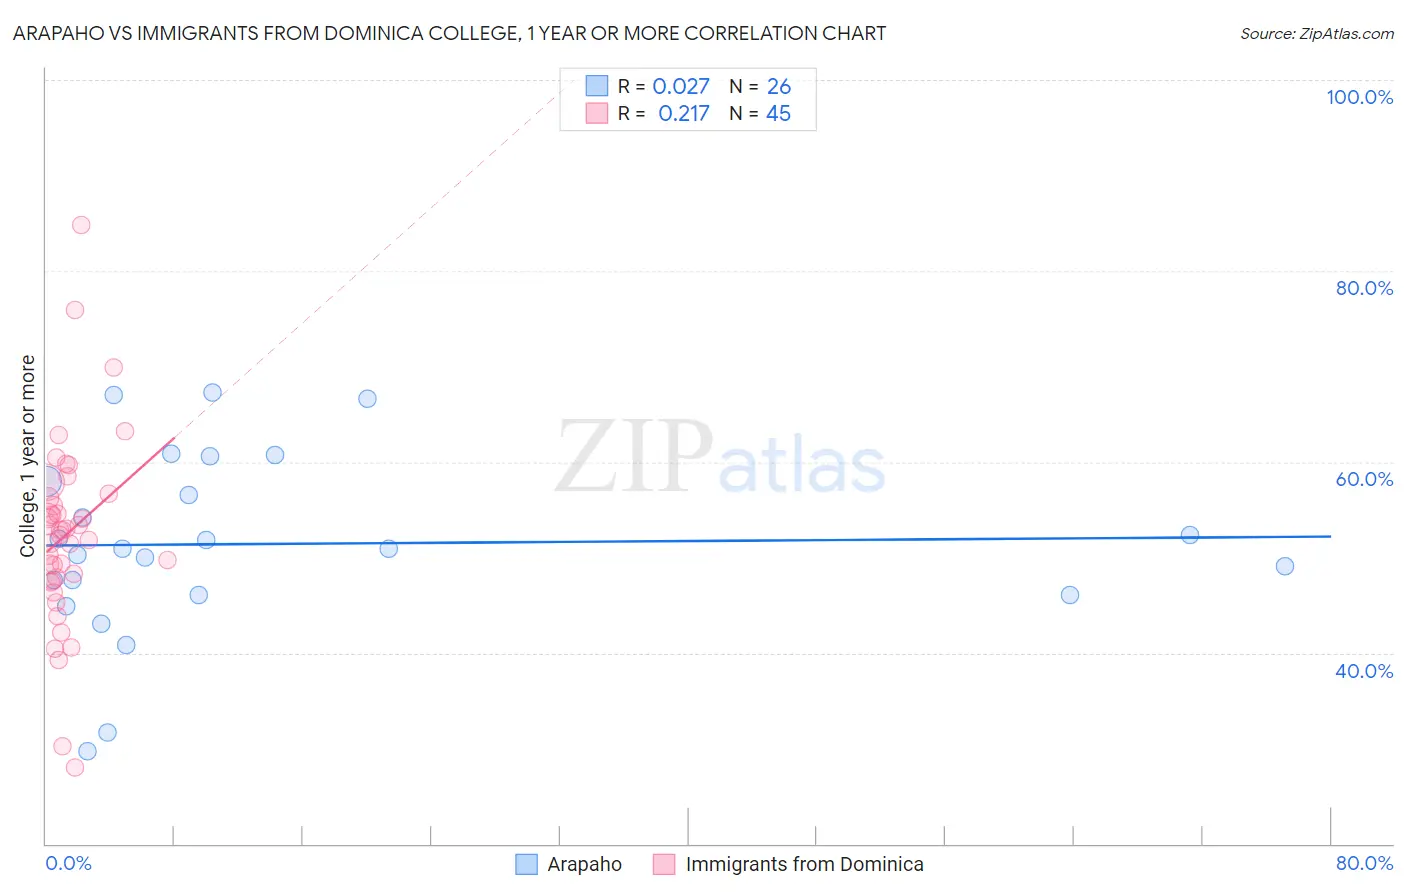
Arapaho vs Immigrants from Dominica College, 1 year or more Correlation Chart
The statistical analysis conducted on geographies consisting of 29,780,040 people shows no correlation between the proportion of Arapaho and percentage of population with at least college, 1 year or more education in the United States with a correlation coefficient (R) of 0.027 and weighted average of 54.1%. Similarly, the statistical analysis conducted on geographies consisting of 83,795,636 people shows a weak positive correlation between the proportion of Immigrants from Dominica and percentage of population with at least college, 1 year or more education in the United States with a correlation coefficient (R) of 0.217 and weighted average of 52.5%, a difference of 3.0%.
College, 1 year or more Correlation Summary
| Measurement | Arapaho | Immigrants from Dominica |
| Minimum | 29.7% | 28.1% |
| Maximum | 67.3% | 84.8% |
| Range | 37.6% | 56.7% |
| Mean | 51.4% | 52.4% |
| Median | 50.9% | 52.8% |
| Interquartile 25% (IQ1) | 46.1% | 47.7% |
| Interquartile 75% (IQ3) | 58.0% | 56.4% |
| Interquartile Range (IQR) | 11.9% | 8.7% |
| Standard Deviation (Sample) | 9.5% | 10.0% |
| Standard Deviation (Population) | 9.3% | 9.9% |
Demographics Similar to Arapaho and Immigrants from Dominica by College, 1 year or more
In terms of college, 1 year or more, the demographic groups most similar to Arapaho are Immigrants from Jamaica (54.2%, a difference of 0.020%), Cheyenne (54.1%, a difference of 0.060%), Colville (54.1%, a difference of 0.070%), Guyanese (54.1%, a difference of 0.11%), and Nicaraguan (53.9%, a difference of 0.47%). Similarly, the demographic groups most similar to Immigrants from Dominica are Paiute (52.9%, a difference of 0.59%), Sioux (53.0%, a difference of 0.87%), Yaqui (53.2%, a difference of 1.2%), Cherokee (53.2%, a difference of 1.2%), and Black/African American (53.3%, a difference of 1.4%).
| Demographics | Rating | Rank | College, 1 year or more |
| Immigrants | Jamaica | 0.1 /100 | #278 | Tragic 54.2% |
| Arapaho | 0.1 /100 | #279 | Tragic 54.1% |
| Cheyenne | 0.1 /100 | #280 | Tragic 54.1% |
| Colville | 0.1 /100 | #281 | Tragic 54.1% |
| Guyanese | 0.1 /100 | #282 | Tragic 54.1% |
| Nicaraguans | 0.1 /100 | #283 | Tragic 53.9% |
| Ute | 0.1 /100 | #284 | Tragic 53.8% |
| Immigrants | Guyana | 0.1 /100 | #285 | Tragic 53.5% |
| Central American Indians | 0.1 /100 | #286 | Tragic 53.5% |
| Immigrants | Belize | 0.1 /100 | #287 | Tragic 53.5% |
| Alaska Natives | 0.0 /100 | #288 | Tragic 53.4% |
| Immigrants | Ecuador | 0.0 /100 | #289 | Tragic 53.4% |
| Alaskan Athabascans | 0.0 /100 | #290 | Tragic 53.4% |
| Cubans | 0.0 /100 | #291 | Tragic 53.4% |
| Chickasaw | 0.0 /100 | #292 | Tragic 53.3% |
| Blacks/African Americans | 0.0 /100 | #293 | Tragic 53.3% |
| Cherokee | 0.0 /100 | #294 | Tragic 53.2% |
| Yaqui | 0.0 /100 | #295 | Tragic 53.2% |
| Sioux | 0.0 /100 | #296 | Tragic 53.0% |
| Paiute | 0.0 /100 | #297 | Tragic 52.9% |
| Immigrants | Dominica | 0.0 /100 | #298 | Tragic 52.5% |