Arapaho vs Immigrants from Uzbekistan Unemployment Among Ages 45 to 54 years

COMPARE

Arapaho
Race
Ancestry
AfghanAfricanAlaska NativeAlaskan AthabascanAlbanianAleutAlsatianAmericanApacheArabArapahoArgentineanArmenianAssyrian/Chaldean/SyriacAustralianAustrianBahamianBangladeshiBarbadianBasqueBelgianBelizeanBermudanBhutaneseBlackfeetBolivianBrazilianBritishBritish West IndianBulgarianBurmeseCajunCambodianCanadianCape VerdeanCarpatho RusynCelticCentral AmericanCentral American IndianCherokeeCheyenneChickasawChileanChineseChippewaChoctawColombianColvilleComancheCosta RicanCreeCreekCroatianCrowCubanCypriotCzechCzechoslovakianDanishDelawareDominicanDutchDutch West IndianEastern EuropeanEcuadorianEgyptianEnglishEstonianEthiopianEuropeanFijianFilipinoFinnishFrenchFrench American IndianFrench CanadianGermanGerman RussianGhanaianGreekGuamanian/ChamorroGuatemalanGuyaneseHaitianHmongHonduranHopiHoumaHungarianIcelanderIndian (Asian)IndonesianInupiatIranianIraqiIrishIroquoisIsraeliItalianJamaicanJapaneseJordanianKenyanKiowaKoreanLaotianLatvianLebaneseLiberianLithuanianLumbeeLuxembourgerMacedonianMalaysianMalteseMarshalleseMenomineeMexicanMexican American IndianMongolianMoroccanNative HawaiianNavajoNepaleseNew ZealanderNicaraguanNigerianNorthern EuropeanNorwegianOkinawanOsageOttawaPaiutePakistaniPalestinianPanamanianParaguayanPennsylvania GermanPeruvianPimaPolishPortuguesePotawatomiPuebloPuerto RicanPuget Sound SalishRomanianRussianSalvadoranSamoanScandinavianScotch-IrishScottishSeminoleSenegaleseSerbianShoshoneSierra LeoneanSiouxSlavicSlovakSloveneSomaliSouth AfricanSouth AmericanSouth American IndianSoviet UnionSpaniardSpanishSpanish AmericanSpanish American IndianSri LankanSubsaharan AfricanSudaneseSwedishSwissSyrianTaiwaneseThaiTlingit-HaidaTohono O'OdhamTonganTrinidadian and TobagonianTsimshianTurkishU.S. Virgin IslanderUgandanUkrainianUruguayanUteVenezuelanVietnameseWelshWest IndianYakamaYaquiYugoslavianYumanYup'ikZimbabwean
Immigration
NonimmigrantsImmigrantsAfghanistanAfricaAlbaniaArgentinaArmeniaAsiaAustraliaAustriaBahamasBangladeshBarbadosBelarusBelgiumBelizeBoliviaBosnia and HerzegovinaBrazilBulgariaBurma/MyanmarCabo VerdeCambodiaCameroonCanadaCaribbeanCentral AmericaChileChinaColombiaCongoCosta RicaCroatiaCubaCzechoslovakiaDenmarkDominicaDominican RepublicEastern AfricaEastern AsiaEastern EuropeEcuadorEgyptEl SalvadorEnglandEritreaEthiopiaEuropeFijiFranceGermanyGhanaGreeceGrenadaGuatemalaGuyanaHaitiHondurasHong KongHungaryIndiaIndonesiaIranIraqIrelandIsraelItalyJamaicaJapanJordanKazakhstanKenyaKoreaKuwaitLaosLatin AmericaLatviaLebanonLiberiaLithuaniaMalaysiaMexicoMicronesiaMiddle AfricaMoldovaMoroccoNepalNetherlandsNicaraguaNigeriaNorth AmericaNorth MacedoniaNorthern AfricaNorthern EuropeNorwayOceaniaPakistanPanamaPeruPhilippinesPolandPortugalRomaniaRussiaSaudi ArabiaScotlandSenegalSerbiaSierra LeoneSingaporeSomaliaSouth AfricaSouth AmericaSouth Central AsiaSouth Eastern AsiaSouthern EuropeSpainSri LankaSt. Vincent and the GrenadinesSudanSwedenSwitzerlandSyriaTaiwanThailandTrinidad and TobagoTurkeyUgandaUkraineUruguayVenezuelaVietnamWest IndiesWestern AfricaWestern AsiaWestern EuropeYemenZaireZimbabweAzores
Immigrants from Uzbekistan
Race
Ancestry
AfghanAfricanAlaska NativeAlaskan AthabascanAlbanianAleutAlsatianAmericanApacheArabArgentineanArmenianAssyrian/Chaldean/SyriacAustralianAustrianBahamianBangladeshiBarbadianBasqueBelgianBelizeanBermudanBhutaneseBlackfeetBolivianBrazilianBritishBritish West IndianBulgarianBurmeseCajunCambodianCanadianCape VerdeanCarpatho RusynCelticCentral AmericanCentral American IndianCherokeeCheyenneChickasawChileanChineseChippewaChoctawColombianColvilleComancheCosta RicanCreeCreekCroatianCrowCubanCypriotCzechCzechoslovakianDanishDelawareDominicanDutchDutch West IndianEastern EuropeanEcuadorianEgyptianEnglishEstonianEthiopianEuropeanFijianFilipinoFinnishFrenchFrench American IndianFrench CanadianGermanGerman RussianGhanaianGreekGuamanian/ChamorroGuatemalanGuyaneseHaitianHmongHonduranHopiHoumaHungarianIcelanderIndian (Asian)IndonesianInupiatIranianIraqiIrishIroquoisIsraeliItalianJamaicanJapaneseJordanianKenyanKiowaKoreanLaotianLatvianLebaneseLiberianLithuanianLumbeeLuxembourgerMacedonianMalaysianMalteseMarshalleseMenomineeMexicanMexican American IndianMongolianMoroccanNative HawaiianNavajoNepaleseNew ZealanderNicaraguanNigerianNorthern EuropeanNorwegianOkinawanOsageOttawaPaiutePakistaniPalestinianPanamanianParaguayanPennsylvania GermanPeruvianPimaPolishPortuguesePotawatomiPuebloPuerto RicanPuget Sound SalishRomanianRussianSalvadoranSamoanScandinavianScotch-IrishScottishSeminoleSenegaleseSerbianShoshoneSierra LeoneanSiouxSlavicSlovakSloveneSomaliSouth AfricanSouth AmericanSouth American IndianSoviet UnionSpaniardSpanishSpanish AmericanSpanish American IndianSri LankanSubsaharan AfricanSudaneseSwedishSwissSyrianTaiwaneseThaiTlingit-HaidaTohono O'OdhamTonganTrinidadian and TobagonianTsimshianTurkishU.S. Virgin IslanderUgandanUkrainianUruguayanUteVenezuelanVietnameseWelshWest IndianYakamaYaquiYugoslavianYumanYup'ikZimbabwean
Immigration
NonimmigrantsImmigrantsAfghanistanAfricaAlbaniaArgentinaArmeniaAsiaAustraliaAustriaBahamasBangladeshBarbadosBelarusBelgiumBelizeBoliviaBosnia and HerzegovinaBrazilBulgariaBurma/MyanmarCabo VerdeCambodiaCameroonCanadaCaribbeanCentral AmericaChileChinaColombiaCongoCosta RicaCroatiaCubaCzechoslovakiaDenmarkDominicaDominican RepublicEastern AfricaEastern AsiaEastern EuropeEcuadorEgyptEl SalvadorEnglandEritreaEthiopiaEuropeFijiFranceGermanyGhanaGreeceGrenadaGuatemalaGuyanaHaitiHondurasHong KongHungaryIndiaIndonesiaIranIraqIrelandIsraelItalyJamaicaJapanJordanKazakhstanKenyaKoreaKuwaitLaosLatin AmericaLatviaLebanonLiberiaLithuaniaMalaysiaMexicoMicronesiaMiddle AfricaMoldovaMoroccoNepalNetherlandsNicaraguaNigeriaNorth AmericaNorth MacedoniaNorthern AfricaNorthern EuropeNorwayOceaniaPakistanPanamaPeruPhilippinesPolandPortugalRomaniaRussiaSaudi ArabiaScotlandSenegalSerbiaSierra LeoneSingaporeSomaliaSouth AfricaSouth AmericaSouth Central AsiaSouth Eastern AsiaSouthern EuropeSpainSri LankaSt. Vincent and the GrenadinesSudanSwedenSwitzerlandSyriaTaiwanThailandTrinidad and TobagoTurkeyUgandaUkraineUruguayUzbekistanVenezuelaVietnamWest IndiesWestern AfricaWestern AsiaWestern EuropeYemenZaireZimbabweAzores
Unemployment Among Ages 45 to 54 years
Income
Poverty
Unemployment
Labor Participation
Family Structure
Vehicle Availability
Education Level
Disability

Unemployment Among Ages 45 to 54 years Comparison

Arapaho

Immigrants from Uzbekistan

Tragic
Tragic
7.5%
UNEMPLOYMENT AMONG AGES 45 TO 54 YEARS
0.0/ 100
METRIC RATING
339th/ 347
METRIC RANK
4.9%
UNEMPLOYMENT AMONG AGES 45 TO 54 YEARS
0.0/ 100
METRIC RATING
268th/ 347
METRIC RANK

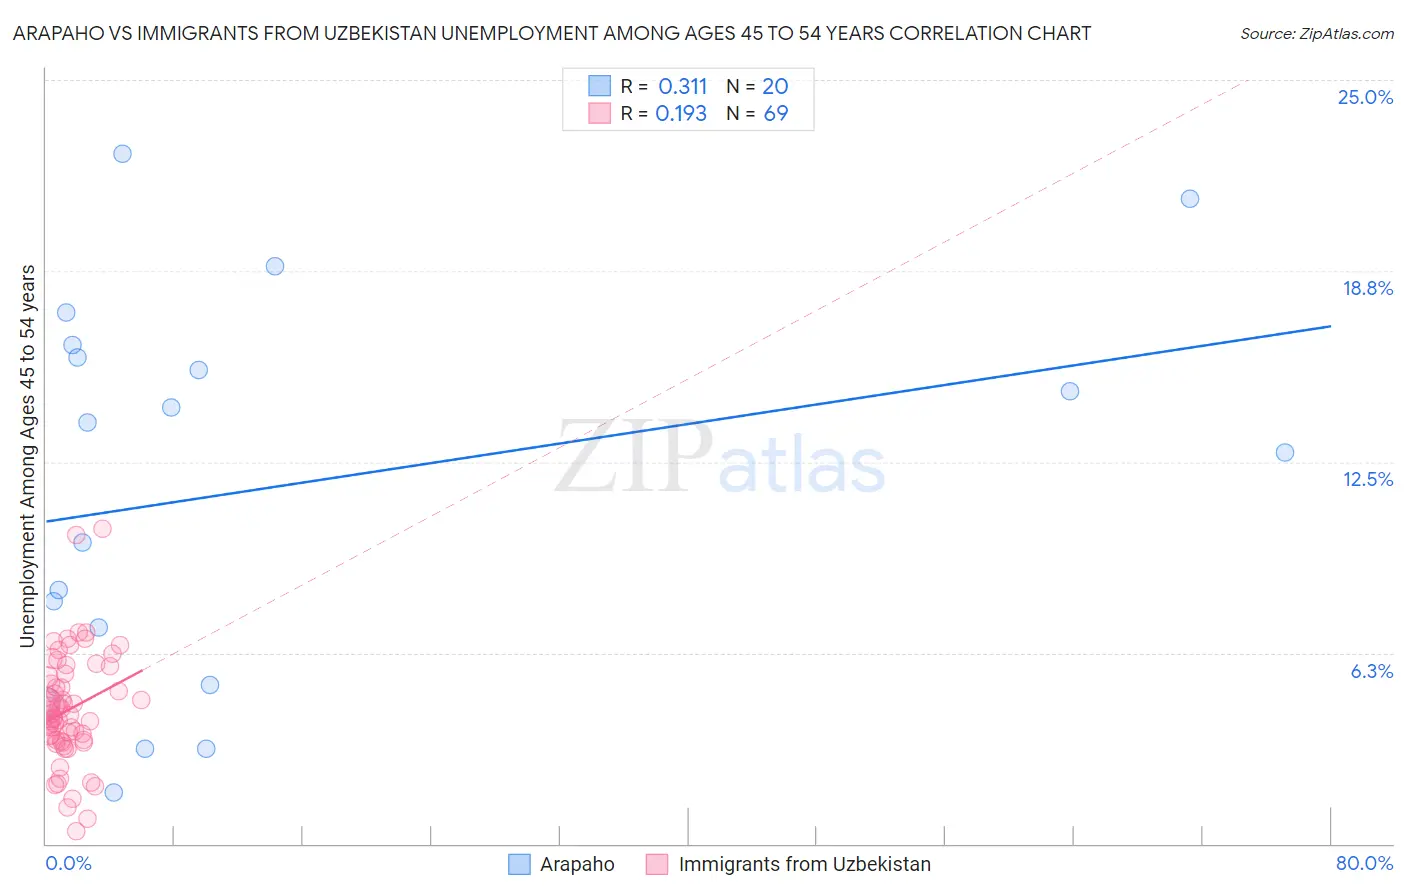
Arapaho vs Immigrants from Uzbekistan Unemployment Among Ages 45 to 54 years Correlation Chart

The statistical analysis conducted on geographies consisting of 29,598,134 people shows a mild positive correlation between the proportion of Arapaho and unemployment rate among population between the ages 45 and 54 in the United States with a correlation coefficient (R) of 0.311 and weighted average of 7.5%. Similarly, the statistical analysis conducted on geographies consisting of 117,964,969 people shows a poor positive correlation between the proportion of Immigrants from Uzbekistan and unemployment rate among population between the ages 45 and 54 in the United States with a correlation coefficient (R) of 0.193 and weighted average of 4.9%, a difference of 51.6%.
Arapaho vs Immigrants from Uzbekistan Unemployment Among Ages 45 to 54 years

Unemployment Among Ages 45 to 54 years Correlation Summary

MeasurementArapahoImmigrants from Uzbekistan
Minimum1.7%0.40%
Maximum22.6%10.3%
Range20.9%9.9%
Mean11.7%4.4%
Median13.3%4.2%
Interquartile 25% (IQ1)6.1%3.4%
Interquartile 75% (IQ3)16.1%5.5%
Interquartile Range (IQR)10.0%2.1%
Standard Deviation (Sample)6.3%1.8%
Standard Deviation (Population)6.2%1.8%

Similar Demographics by Unemployment Among Ages 45 to 54 years

Demographics Similar to Arapaho by Unemployment Among Ages 45 to 54 years

In terms of unemployment among ages 45 to 54 years, the demographic groups most similar to Arapaho are Hopi (7.5%, a difference of 0.46%), Colville (7.4%, a difference of 1.5%), Paiute (7.8%, a difference of 4.0%), Apache (7.0%, a difference of 6.5%), and Puerto Rican (6.8%, a difference of 10.1%).
DemographicsRating | RankUnemployment Among Ages 45 to 54 years
Pima
0.0
/100
|
#332
Tragic
6.4%
Immigrants | Yemen
0.0
/100
|
#333
Tragic
6.5%
Sioux
0.0
/100
|
#334
Tragic
6.6%
Navajo
0.0
/100
|
#335
Tragic
6.7%
Puerto Ricans
0.0
/100
|
#336
Tragic
6.8%
Apache
0.0
/100
|
#337
Tragic
7.0%
Colville
0.0
/100
|
#338
Tragic
7.4%
Arapaho
0.0
/100
|
#339
Tragic
7.5%
Hopi
0.0
/100
|
#340
Tragic
7.5%
Paiute
0.0
/100
|
#341
Tragic
7.8%
Alaskan Athabascans
0.0
/100
|
#342
Tragic
8.5%
Inupiat
0.0
/100
|
#343
Tragic
9.2%
Yuman
0.0
/100
|
#344
Tragic
9.5%
Cheyenne
0.0
/100
|
#345
Tragic
10.6%
Yup'ik
0.0
/100
|
#346
Tragic
11.9%

Demographics Similar to Immigrants from Uzbekistan by Unemployment Among Ages 45 to 54 years

In terms of unemployment among ages 45 to 54 years, the demographic groups most similar to Immigrants from Uzbekistan are Bahamian (4.9%, a difference of 0.090%), Ghanaian (4.9%, a difference of 0.18%), Immigrants from Somalia (4.9%, a difference of 0.30%), Somali (5.0%, a difference of 0.39%), and Immigrants from Ghana (5.0%, a difference of 0.53%).
DemographicsRating | RankUnemployment Among Ages 45 to 54 years
Guatemalans
0.1
/100
|
#261
Tragic
4.9%
Mexicans
0.1
/100
|
#262
Tragic
4.9%
Immigrants | Fiji
0.1
/100
|
#263
Tragic
4.9%
Immigrants | Guatemala
0.1
/100
|
#264
Tragic
4.9%
Immigrants | Somalia
0.1
/100
|
#265
Tragic
4.9%
Ghanaians
0.0
/100
|
#266
Tragic
4.9%
Bahamians
0.0
/100
|
#267
Tragic
4.9%
Immigrants | Uzbekistan
0.0
/100
|
#268
Tragic
4.9%
Somalis
0.0
/100
|
#269
Tragic
5.0%
Immigrants | Ghana
0.0
/100
|
#270
Tragic
5.0%
Cajuns
0.0
/100
|
#271
Tragic
5.0%
Immigrants | Central America
0.0
/100
|
#272
Tragic
5.0%
Immigrants | Latin America
0.0
/100
|
#273
Tragic
5.0%
U.S. Virgin Islanders
0.0
/100
|
#274
Tragic
5.0%
Bermudans
0.0
/100
|
#275
Tragic
5.0%