English vs West Indian Associate's Degree
COMPARE
English
West Indian
Associate's Degree
Associate's Degree Comparison
English
West Indians
46.4%
ASSOCIATE'S DEGREE
50.0/ 100
METRIC RATING
174th/ 347
METRIC RANK
43.8%
ASSOCIATE'S DEGREE
5.2/ 100
METRIC RATING
224th/ 347
METRIC RANK
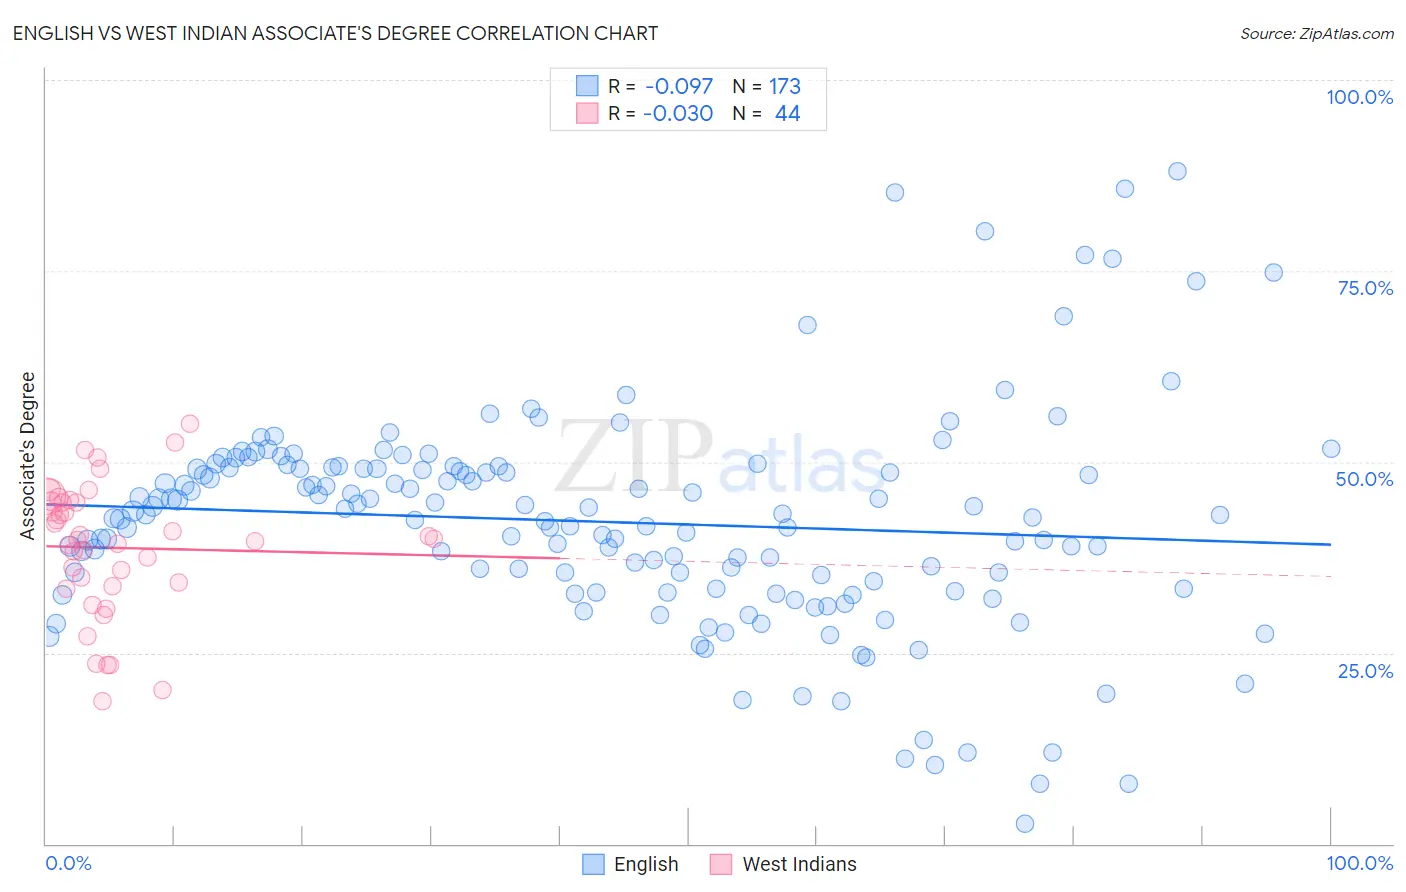
English vs West Indian Associate's Degree Correlation Chart
The statistical analysis conducted on geographies consisting of 579,836,667 people shows a slight negative correlation between the proportion of English and percentage of population with at least associate's degree education in the United States with a correlation coefficient (R) of -0.097 and weighted average of 46.4%. Similarly, the statistical analysis conducted on geographies consisting of 254,053,499 people shows no correlation between the proportion of West Indians and percentage of population with at least associate's degree education in the United States with a correlation coefficient (R) of -0.030 and weighted average of 43.8%, a difference of 5.8%.
Associate's Degree Correlation Summary
| Measurement | English | West Indian |
| Minimum | 2.6% | 18.6% |
| Maximum | 88.0% | 54.9% |
| Range | 85.4% | 36.3% |
| Mean | 42.1% | 38.7% |
| Median | 43.1% | 39.8% |
| Interquartile 25% (IQ1) | 33.3% | 33.9% |
| Interquartile 75% (IQ3) | 49.2% | 44.7% |
| Interquartile Range (IQR) | 15.8% | 10.8% |
| Standard Deviation (Sample) | 14.2% | 8.6% |
| Standard Deviation (Population) | 14.2% | 8.5% |
Similar Demographics by Associate's Degree
Demographics Similar to English by Associate's Degree
In terms of associate's degree, the demographic groups most similar to English are Immigrants from Iraq (46.4%, a difference of 0.020%), Peruvian (46.4%, a difference of 0.040%), Belgian (46.3%, a difference of 0.090%), Finnish (46.3%, a difference of 0.11%), and Slovak (46.3%, a difference of 0.12%).
| Demographics | Rating | Rank | Associate's Degree |
| Immigrants | Sierra Leone | 59.2 /100 | #167 | Average 46.7% |
| Immigrants | Somalia | 55.5 /100 | #168 | Average 46.5% |
| Uruguayans | 55.4 /100 | #169 | Average 46.5% |
| Irish | 53.6 /100 | #170 | Average 46.5% |
| Basques | 52.8 /100 | #171 | Average 46.5% |
| Peruvians | 50.5 /100 | #172 | Average 46.4% |
| Immigrants | Iraq | 50.3 /100 | #173 | Average 46.4% |
| English | 50.0 /100 | #174 | Average 46.4% |
| Belgians | 48.9 /100 | #175 | Average 46.3% |
| Finns | 48.5 /100 | #176 | Average 46.3% |
| Slovaks | 48.4 /100 | #177 | Average 46.3% |
| Immigrants | Bosnia and Herzegovina | 48.3 /100 | #178 | Average 46.3% |
| Sri Lankans | 47.6 /100 | #179 | Average 46.3% |
| Bermudans | 46.4 /100 | #180 | Average 46.2% |
| Immigrants | Colombia | 41.3 /100 | #181 | Average 46.0% |
Demographics Similar to West Indians by Associate's Degree
In terms of associate's degree, the demographic groups most similar to West Indians are Subsaharan African (43.9%, a difference of 0.14%), Guamanian/Chamorro (43.8%, a difference of 0.15%), Barbadian (43.9%, a difference of 0.24%), Immigrants from Burma/Myanmar (43.7%, a difference of 0.37%), and Immigrants from Western Africa (44.1%, a difference of 0.51%).
| Demographics | Rating | Rank | Associate's Degree |
| Immigrants | Immigrants | 10.5 /100 | #217 | Poor 44.5% |
| Spanish | 9.4 /100 | #218 | Tragic 44.4% |
| Whites/Caucasians | 7.5 /100 | #219 | Tragic 44.2% |
| Portuguese | 7.2 /100 | #220 | Tragic 44.1% |
| Immigrants | Western Africa | 6.6 /100 | #221 | Tragic 44.1% |
| Barbadians | 5.8 /100 | #222 | Tragic 43.9% |
| Sub-Saharan Africans | 5.5 /100 | #223 | Tragic 43.9% |
| West Indians | 5.2 /100 | #224 | Tragic 43.8% |
| Guamanians/Chamorros | 4.8 /100 | #225 | Tragic 43.8% |
| Immigrants | Burma/Myanmar | 4.3 /100 | #226 | Tragic 43.7% |
| Trinidadians and Tobagonians | 4.0 /100 | #227 | Tragic 43.6% |
| Hmong | 3.2 /100 | #228 | Tragic 43.4% |
| Immigrants | Trinidad and Tobago | 3.0 /100 | #229 | Tragic 43.3% |
| Immigrants | Barbados | 2.9 /100 | #230 | Tragic 43.3% |
| Liberians | 2.9 /100 | #231 | Tragic 43.3% |