Apache vs Italian Associate's Degree
COMPARE
Apache
Italian
Associate's Degree
Associate's Degree Comparison
Apache
Italians
36.2%
ASSOCIATE'S DEGREE
0.0/ 100
METRIC RATING
330th/ 347
METRIC RANK
48.7%
ASSOCIATE'S DEGREE
93.9/ 100
METRIC RATING
122nd/ 347
METRIC RANK
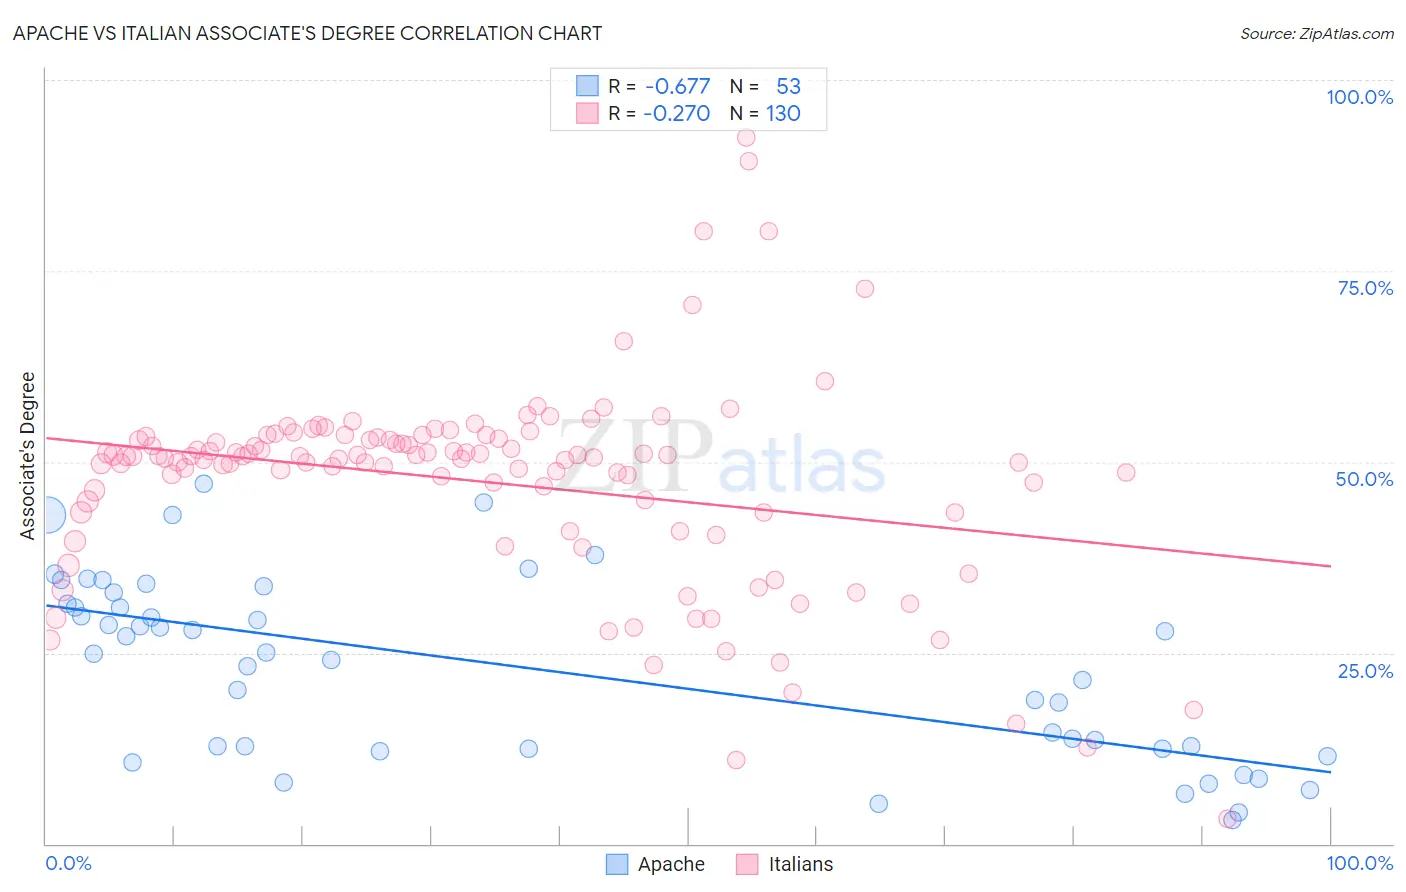
Apache vs Italian Associate's Degree Correlation Chart
The statistical analysis conducted on geographies consisting of 231,140,415 people shows a significant negative correlation between the proportion of Apache and percentage of population with at least associate's degree education in the United States with a correlation coefficient (R) of -0.677 and weighted average of 36.2%. Similarly, the statistical analysis conducted on geographies consisting of 575,016,726 people shows a weak negative correlation between the proportion of Italians and percentage of population with at least associate's degree education in the United States with a correlation coefficient (R) of -0.270 and weighted average of 48.7%, a difference of 34.4%.
Associate's Degree Correlation Summary
| Measurement | Apache | Italian |
| Minimum | 3.2% | 3.2% |
| Maximum | 47.2% | 92.5% |
| Range | 44.0% | 89.3% |
| Mean | 23.0% | 47.4% |
| Median | 24.9% | 50.6% |
| Interquartile 25% (IQ1) | 12.5% | 43.4% |
| Interquartile 75% (IQ3) | 32.1% | 53.1% |
| Interquartile Range (IQR) | 19.6% | 9.7% |
| Standard Deviation (Sample) | 11.9% | 13.4% |
| Standard Deviation (Population) | 11.7% | 13.4% |
Similar Demographics by Associate's Degree
Demographics Similar to Apache by Associate's Degree
In terms of associate's degree, the demographic groups most similar to Apache are Paiute (36.4%, a difference of 0.31%), Alaskan Athabascan (36.5%, a difference of 0.60%), Dutch West Indian (36.5%, a difference of 0.61%), Kiowa (36.5%, a difference of 0.63%), and Menominee (36.7%, a difference of 1.2%).
| Demographics | Rating | Rank | Associate's Degree |
| Immigrants | Cabo Verde | 0.0 /100 | #323 | Tragic 36.8% |
| Arapaho | 0.0 /100 | #324 | Tragic 36.7% |
| Menominee | 0.0 /100 | #325 | Tragic 36.7% |
| Kiowa | 0.0 /100 | #326 | Tragic 36.5% |
| Dutch West Indians | 0.0 /100 | #327 | Tragic 36.5% |
| Alaskan Athabascans | 0.0 /100 | #328 | Tragic 36.5% |
| Paiute | 0.0 /100 | #329 | Tragic 36.4% |
| Apache | 0.0 /100 | #330 | Tragic 36.2% |
| Immigrants | Azores | 0.0 /100 | #331 | Tragic 35.6% |
| Immigrants | Central America | 0.0 /100 | #332 | Tragic 35.0% |
| Mexicans | 0.0 /100 | #333 | Tragic 35.0% |
| Natives/Alaskans | 0.0 /100 | #334 | Tragic 34.9% |
| Spanish American Indians | 0.0 /100 | #335 | Tragic 34.9% |
| Hopi | 0.0 /100 | #336 | Tragic 34.6% |
| Lumbee | 0.0 /100 | #337 | Tragic 34.1% |
Demographics Similar to Italians by Associate's Degree
In terms of associate's degree, the demographic groups most similar to Italians are Ugandan (48.7%, a difference of 0.0%), Brazilian (48.7%, a difference of 0.060%), Alsatian (48.8%, a difference of 0.23%), Lebanese (48.8%, a difference of 0.25%), and Albanian (48.8%, a difference of 0.26%).
| Demographics | Rating | Rank | Associate's Degree |
| Luxembourgers | 95.1 /100 | #115 | Exceptional 48.9% |
| British | 95.0 /100 | #116 | Exceptional 48.9% |
| Afghans | 94.8 /100 | #117 | Exceptional 48.9% |
| Albanians | 94.7 /100 | #118 | Exceptional 48.8% |
| Lebanese | 94.6 /100 | #119 | Exceptional 48.8% |
| Alsatians | 94.6 /100 | #120 | Exceptional 48.8% |
| Ugandans | 93.9 /100 | #121 | Exceptional 48.7% |
| Italians | 93.9 /100 | #122 | Exceptional 48.7% |
| Brazilians | 93.7 /100 | #123 | Exceptional 48.7% |
| Serbians | 92.6 /100 | #124 | Exceptional 48.5% |
| Chinese | 92.5 /100 | #125 | Exceptional 48.5% |
| Immigrants | Syria | 92.2 /100 | #126 | Exceptional 48.5% |
| Immigrants | Uganda | 92.1 /100 | #127 | Exceptional 48.5% |
| Immigrants | Eastern Africa | 91.6 /100 | #128 | Exceptional 48.4% |
| Swedes | 91.5 /100 | #129 | Exceptional 48.4% |