Apache vs Nepalese Associate's Degree
COMPARE
Apache
Nepalese
Associate's Degree
Associate's Degree Comparison
Apache
Nepalese
36.2%
ASSOCIATE'S DEGREE
0.0/ 100
METRIC RATING
330th/ 347
METRIC RANK
39.0%
ASSOCIATE'S DEGREE
0.0/ 100
METRIC RATING
293rd/ 347
METRIC RANK
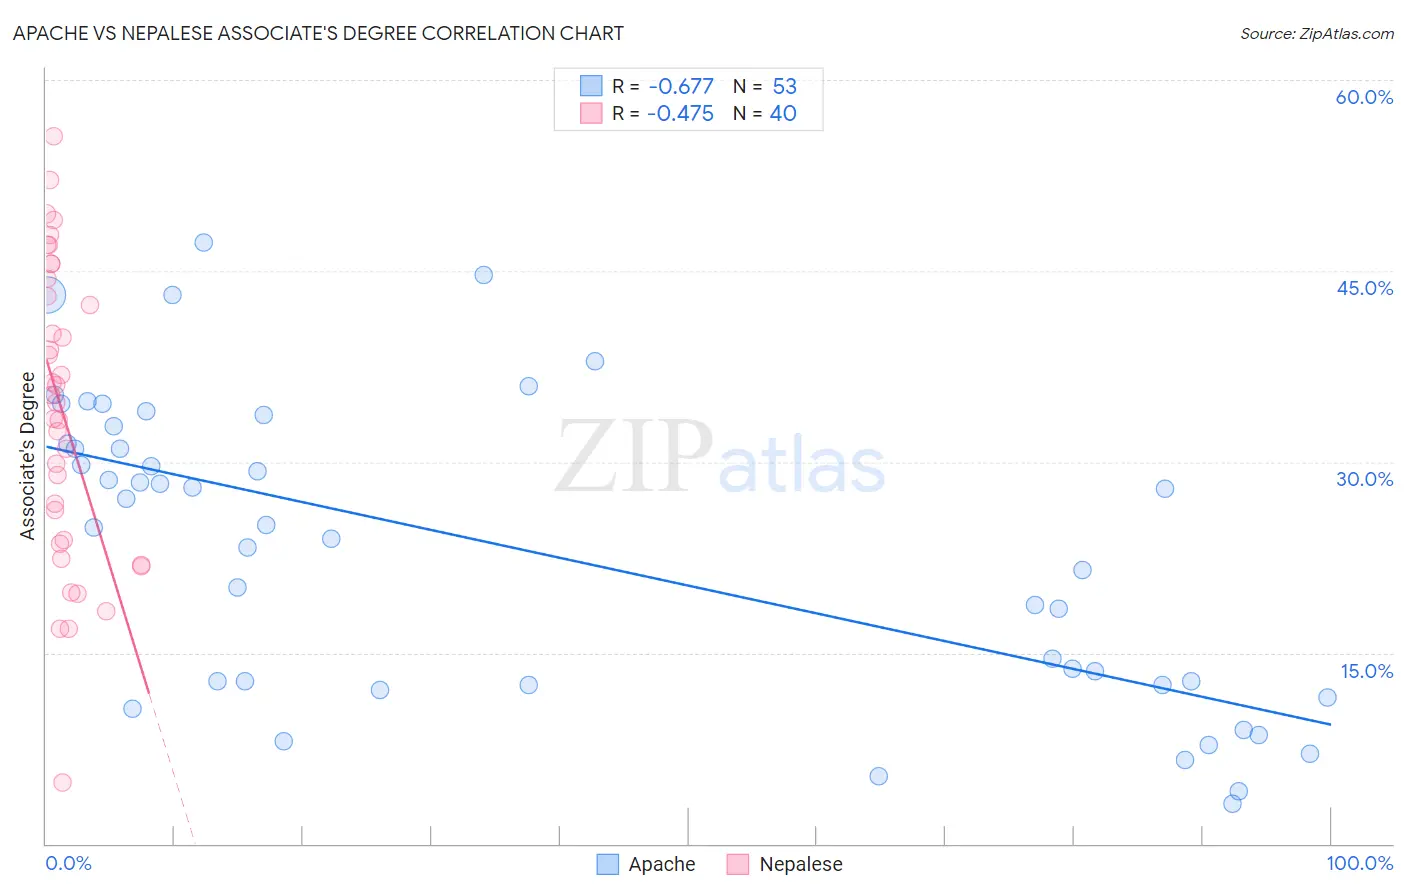
Apache vs Nepalese Associate's Degree Correlation Chart
The statistical analysis conducted on geographies consisting of 231,140,415 people shows a significant negative correlation between the proportion of Apache and percentage of population with at least associate's degree education in the United States with a correlation coefficient (R) of -0.677 and weighted average of 36.2%. Similarly, the statistical analysis conducted on geographies consisting of 24,521,755 people shows a moderate negative correlation between the proportion of Nepalese and percentage of population with at least associate's degree education in the United States with a correlation coefficient (R) of -0.475 and weighted average of 39.0%, a difference of 7.7%.
Associate's Degree Correlation Summary
| Measurement | Apache | Nepalese |
| Minimum | 3.2% | 4.8% |
| Maximum | 47.2% | 55.5% |
| Range | 44.0% | 50.8% |
| Mean | 23.0% | 33.9% |
| Median | 24.9% | 35.0% |
| Interquartile 25% (IQ1) | 12.5% | 23.7% |
| Interquartile 75% (IQ3) | 32.1% | 43.7% |
| Interquartile Range (IQR) | 19.6% | 20.0% |
| Standard Deviation (Sample) | 11.9% | 11.7% |
| Standard Deviation (Population) | 11.7% | 11.6% |
Similar Demographics by Associate's Degree
Demographics Similar to Apache by Associate's Degree
In terms of associate's degree, the demographic groups most similar to Apache are Paiute (36.4%, a difference of 0.31%), Alaskan Athabascan (36.5%, a difference of 0.60%), Dutch West Indian (36.5%, a difference of 0.61%), Kiowa (36.5%, a difference of 0.63%), and Menominee (36.7%, a difference of 1.2%).
| Demographics | Rating | Rank | Associate's Degree |
| Immigrants | Cabo Verde | 0.0 /100 | #323 | Tragic 36.8% |
| Arapaho | 0.0 /100 | #324 | Tragic 36.7% |
| Menominee | 0.0 /100 | #325 | Tragic 36.7% |
| Kiowa | 0.0 /100 | #326 | Tragic 36.5% |
| Dutch West Indians | 0.0 /100 | #327 | Tragic 36.5% |
| Alaskan Athabascans | 0.0 /100 | #328 | Tragic 36.5% |
| Paiute | 0.0 /100 | #329 | Tragic 36.4% |
| Apache | 0.0 /100 | #330 | Tragic 36.2% |
| Immigrants | Azores | 0.0 /100 | #331 | Tragic 35.6% |
| Immigrants | Central America | 0.0 /100 | #332 | Tragic 35.0% |
| Mexicans | 0.0 /100 | #333 | Tragic 35.0% |
| Natives/Alaskans | 0.0 /100 | #334 | Tragic 34.9% |
| Spanish American Indians | 0.0 /100 | #335 | Tragic 34.9% |
| Hopi | 0.0 /100 | #336 | Tragic 34.6% |
| Lumbee | 0.0 /100 | #337 | Tragic 34.1% |
Demographics Similar to Nepalese by Associate's Degree
In terms of associate's degree, the demographic groups most similar to Nepalese are Salvadoran (39.0%, a difference of 0.0%), Black/African American (39.1%, a difference of 0.25%), Honduran (38.9%, a difference of 0.29%), Cherokee (38.9%, a difference of 0.46%), and Dominican (39.3%, a difference of 0.54%).
| Demographics | Rating | Rank | Associate's Degree |
| Immigrants | Caribbean | 0.0 /100 | #286 | Tragic 39.7% |
| Aleuts | 0.0 /100 | #287 | Tragic 39.6% |
| Immigrants | Cuba | 0.0 /100 | #288 | Tragic 39.5% |
| Central Americans | 0.0 /100 | #289 | Tragic 39.4% |
| Immigrants | Haiti | 0.0 /100 | #290 | Tragic 39.3% |
| Dominicans | 0.0 /100 | #291 | Tragic 39.3% |
| Blacks/African Americans | 0.0 /100 | #292 | Tragic 39.1% |
| Nepalese | 0.0 /100 | #293 | Tragic 39.0% |
| Salvadorans | 0.0 /100 | #294 | Tragic 39.0% |
| Hondurans | 0.0 /100 | #295 | Tragic 38.9% |
| Cherokee | 0.0 /100 | #296 | Tragic 38.9% |
| Cape Verdeans | 0.0 /100 | #297 | Tragic 38.8% |
| Cheyenne | 0.0 /100 | #298 | Tragic 38.7% |
| Ute | 0.0 /100 | #299 | Tragic 38.6% |
| Chickasaw | 0.0 /100 | #300 | Tragic 38.6% |