Immigrants from Zimbabwe vs West Indian Associate's Degree
COMPARE
Immigrants from Zimbabwe
West Indian
Associate's Degree
Associate's Degree Comparison
Immigrants from Zimbabwe
West Indians
50.5%
ASSOCIATE'S DEGREE
99.2/ 100
METRIC RATING
76th/ 347
METRIC RANK
43.8%
ASSOCIATE'S DEGREE
5.2/ 100
METRIC RATING
224th/ 347
METRIC RANK
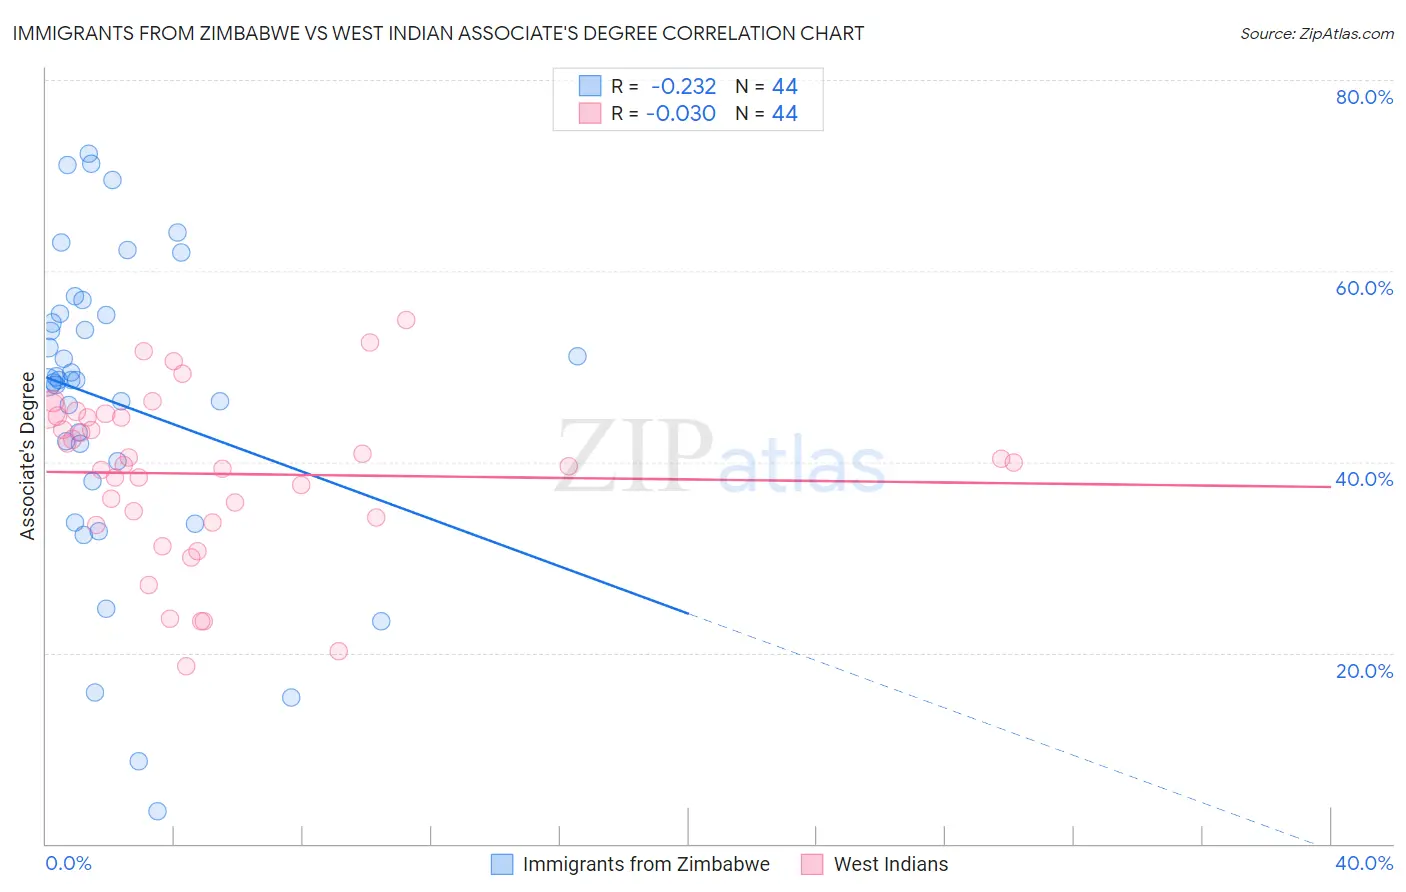
Immigrants from Zimbabwe vs West Indian Associate's Degree Correlation Chart
The statistical analysis conducted on geographies consisting of 117,809,864 people shows a weak negative correlation between the proportion of Immigrants from Zimbabwe and percentage of population with at least associate's degree education in the United States with a correlation coefficient (R) of -0.232 and weighted average of 50.5%. Similarly, the statistical analysis conducted on geographies consisting of 254,053,499 people shows no correlation between the proportion of West Indians and percentage of population with at least associate's degree education in the United States with a correlation coefficient (R) of -0.030 and weighted average of 43.8%, a difference of 15.2%.
Associate's Degree Correlation Summary
| Measurement | Immigrants from Zimbabwe | West Indian |
| Minimum | 3.5% | 18.6% |
| Maximum | 72.3% | 54.9% |
| Range | 68.9% | 36.3% |
| Mean | 46.2% | 38.7% |
| Median | 48.6% | 39.8% |
| Interquartile 25% (IQ1) | 39.0% | 33.9% |
| Interquartile 75% (IQ3) | 55.5% | 44.7% |
| Interquartile Range (IQR) | 16.4% | 10.8% |
| Standard Deviation (Sample) | 16.2% | 8.6% |
| Standard Deviation (Population) | 16.0% | 8.5% |
Similar Demographics by Associate's Degree
Demographics Similar to Immigrants from Zimbabwe by Associate's Degree
In terms of associate's degree, the demographic groups most similar to Immigrants from Zimbabwe are Immigrants from Lebanon (50.5%, a difference of 0.030%), Immigrants from Eastern Europe (50.5%, a difference of 0.080%), Ethiopian (50.4%, a difference of 0.090%), Armenian (50.4%, a difference of 0.12%), and Maltese (50.4%, a difference of 0.19%).
| Demographics | Rating | Rank | Associate's Degree |
| Egyptians | 99.5 /100 | #69 | Exceptional 50.9% |
| Immigrants | Argentina | 99.5 /100 | #70 | Exceptional 50.9% |
| Immigrants | Romania | 99.5 /100 | #71 | Exceptional 50.9% |
| Immigrants | Pakistan | 99.5 /100 | #72 | Exceptional 50.9% |
| Carpatho Rusyns | 99.3 /100 | #73 | Exceptional 50.6% |
| Lithuanians | 99.3 /100 | #74 | Exceptional 50.6% |
| Immigrants | Scotland | 99.3 /100 | #75 | Exceptional 50.6% |
| Immigrants | Zimbabwe | 99.2 /100 | #76 | Exceptional 50.5% |
| Immigrants | Lebanon | 99.1 /100 | #77 | Exceptional 50.5% |
| Immigrants | Eastern Europe | 99.1 /100 | #78 | Exceptional 50.5% |
| Ethiopians | 99.1 /100 | #79 | Exceptional 50.4% |
| Armenians | 99.1 /100 | #80 | Exceptional 50.4% |
| Maltese | 99.1 /100 | #81 | Exceptional 50.4% |
| Greeks | 98.9 /100 | #82 | Exceptional 50.3% |
| Immigrants | Uzbekistan | 98.9 /100 | #83 | Exceptional 50.3% |
Demographics Similar to West Indians by Associate's Degree
In terms of associate's degree, the demographic groups most similar to West Indians are Subsaharan African (43.9%, a difference of 0.14%), Guamanian/Chamorro (43.8%, a difference of 0.15%), Barbadian (43.9%, a difference of 0.24%), Immigrants from Burma/Myanmar (43.7%, a difference of 0.37%), and Immigrants from Western Africa (44.1%, a difference of 0.51%).
| Demographics | Rating | Rank | Associate's Degree |
| Immigrants | Immigrants | 10.5 /100 | #217 | Poor 44.5% |
| Spanish | 9.4 /100 | #218 | Tragic 44.4% |
| Whites/Caucasians | 7.5 /100 | #219 | Tragic 44.2% |
| Portuguese | 7.2 /100 | #220 | Tragic 44.1% |
| Immigrants | Western Africa | 6.6 /100 | #221 | Tragic 44.1% |
| Barbadians | 5.8 /100 | #222 | Tragic 43.9% |
| Sub-Saharan Africans | 5.5 /100 | #223 | Tragic 43.9% |
| West Indians | 5.2 /100 | #224 | Tragic 43.8% |
| Guamanians/Chamorros | 4.8 /100 | #225 | Tragic 43.8% |
| Immigrants | Burma/Myanmar | 4.3 /100 | #226 | Tragic 43.7% |
| Trinidadians and Tobagonians | 4.0 /100 | #227 | Tragic 43.6% |
| Hmong | 3.2 /100 | #228 | Tragic 43.4% |
| Immigrants | Trinidad and Tobago | 3.0 /100 | #229 | Tragic 43.3% |
| Immigrants | Barbados | 2.9 /100 | #230 | Tragic 43.3% |
| Liberians | 2.9 /100 | #231 | Tragic 43.3% |