Apache vs Filipino Associate's Degree
COMPARE
Apache
Filipino
Associate's Degree
Associate's Degree Comparison
Apache
Filipinos
36.2%
ASSOCIATE'S DEGREE
0.0/ 100
METRIC RATING
330th/ 347
METRIC RANK
59.8%
ASSOCIATE'S DEGREE
100.0/ 100
METRIC RATING
1st/ 347
METRIC RANK
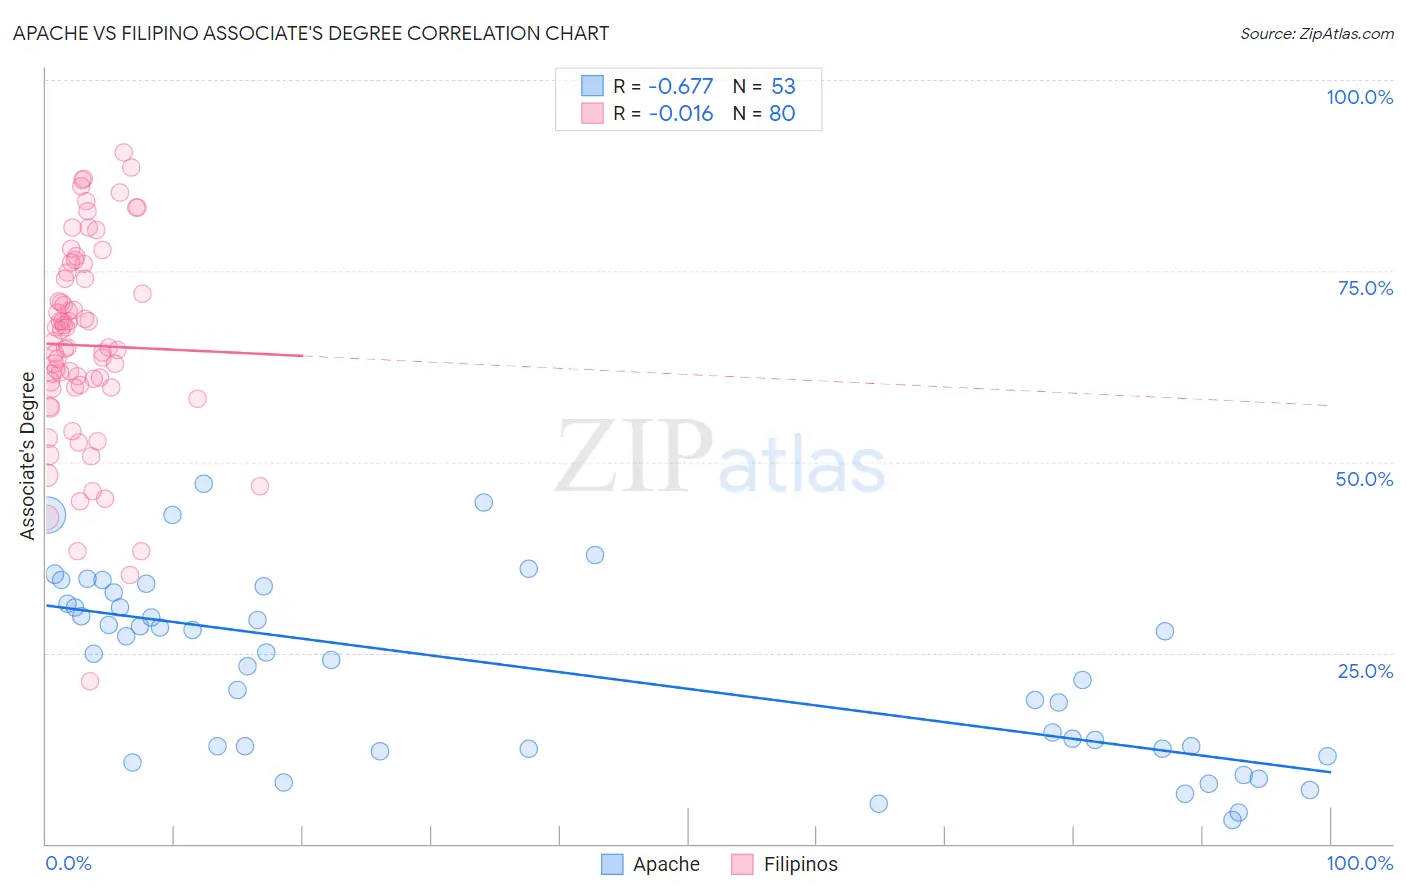
Apache vs Filipino Associate's Degree Correlation Chart
The statistical analysis conducted on geographies consisting of 231,140,415 people shows a significant negative correlation between the proportion of Apache and percentage of population with at least associate's degree education in the United States with a correlation coefficient (R) of -0.677 and weighted average of 36.2%. Similarly, the statistical analysis conducted on geographies consisting of 254,337,502 people shows no correlation between the proportion of Filipinos and percentage of population with at least associate's degree education in the United States with a correlation coefficient (R) of -0.016 and weighted average of 59.8%, a difference of 65.0%.
Associate's Degree Correlation Summary
| Measurement | Apache | Filipino |
| Minimum | 3.2% | 21.2% |
| Maximum | 47.2% | 90.5% |
| Range | 44.0% | 69.3% |
| Mean | 23.0% | 65.3% |
| Median | 24.9% | 65.0% |
| Interquartile 25% (IQ1) | 12.5% | 59.7% |
| Interquartile 75% (IQ3) | 32.1% | 74.4% |
| Interquartile Range (IQR) | 19.6% | 14.7% |
| Standard Deviation (Sample) | 11.9% | 13.5% |
| Standard Deviation (Population) | 11.7% | 13.4% |
Similar Demographics by Associate's Degree
Demographics Similar to Apache by Associate's Degree
In terms of associate's degree, the demographic groups most similar to Apache are Paiute (36.4%, a difference of 0.31%), Alaskan Athabascan (36.5%, a difference of 0.60%), Dutch West Indian (36.5%, a difference of 0.61%), Kiowa (36.5%, a difference of 0.63%), and Menominee (36.7%, a difference of 1.2%).
| Demographics | Rating | Rank | Associate's Degree |
| Immigrants | Cabo Verde | 0.0 /100 | #323 | Tragic 36.8% |
| Arapaho | 0.0 /100 | #324 | Tragic 36.7% |
| Menominee | 0.0 /100 | #325 | Tragic 36.7% |
| Kiowa | 0.0 /100 | #326 | Tragic 36.5% |
| Dutch West Indians | 0.0 /100 | #327 | Tragic 36.5% |
| Alaskan Athabascans | 0.0 /100 | #328 | Tragic 36.5% |
| Paiute | 0.0 /100 | #329 | Tragic 36.4% |
| Apache | 0.0 /100 | #330 | Tragic 36.2% |
| Immigrants | Azores | 0.0 /100 | #331 | Tragic 35.6% |
| Immigrants | Central America | 0.0 /100 | #332 | Tragic 35.0% |
| Mexicans | 0.0 /100 | #333 | Tragic 35.0% |
| Natives/Alaskans | 0.0 /100 | #334 | Tragic 34.9% |
| Spanish American Indians | 0.0 /100 | #335 | Tragic 34.9% |
| Hopi | 0.0 /100 | #336 | Tragic 34.6% |
| Lumbee | 0.0 /100 | #337 | Tragic 34.1% |
Demographics Similar to Filipinos by Associate's Degree
In terms of associate's degree, the demographic groups most similar to Filipinos are Immigrants from Singapore (58.9%, a difference of 1.5%), Immigrants from India (58.5%, a difference of 2.1%), Immigrants from Taiwan (58.4%, a difference of 2.4%), Iranian (58.2%, a difference of 2.8%), and Okinawan (57.7%, a difference of 3.7%).
| Demographics | Rating | Rank | Associate's Degree |
| Filipinos | 100.0 /100 | #1 | Exceptional 59.8% |
| Immigrants | Singapore | 100.0 /100 | #2 | Exceptional 58.9% |
| Immigrants | India | 100.0 /100 | #3 | Exceptional 58.5% |
| Immigrants | Taiwan | 100.0 /100 | #4 | Exceptional 58.4% |
| Iranians | 100.0 /100 | #5 | Exceptional 58.2% |
| Okinawans | 100.0 /100 | #6 | Exceptional 57.7% |
| Immigrants | Iran | 100.0 /100 | #7 | Exceptional 57.7% |
| Thais | 100.0 /100 | #8 | Exceptional 57.4% |
| Immigrants | Israel | 100.0 /100 | #9 | Exceptional 56.8% |
| Cypriots | 100.0 /100 | #10 | Exceptional 56.4% |
| Immigrants | Australia | 100.0 /100 | #11 | Exceptional 55.8% |
| Immigrants | South Central Asia | 100.0 /100 | #12 | Exceptional 55.7% |
| Immigrants | China | 100.0 /100 | #13 | Exceptional 55.5% |
| Immigrants | Hong Kong | 100.0 /100 | #14 | Exceptional 55.4% |
| Immigrants | Eastern Asia | 100.0 /100 | #15 | Exceptional 55.4% |