Aleut vs West Indian Associate's Degree
COMPARE
Aleut
West Indian
Associate's Degree
Associate's Degree Comparison
Aleuts
West Indians
39.6%
ASSOCIATE'S DEGREE
0.0/ 100
METRIC RATING
287th/ 347
METRIC RANK
43.8%
ASSOCIATE'S DEGREE
5.2/ 100
METRIC RATING
224th/ 347
METRIC RANK
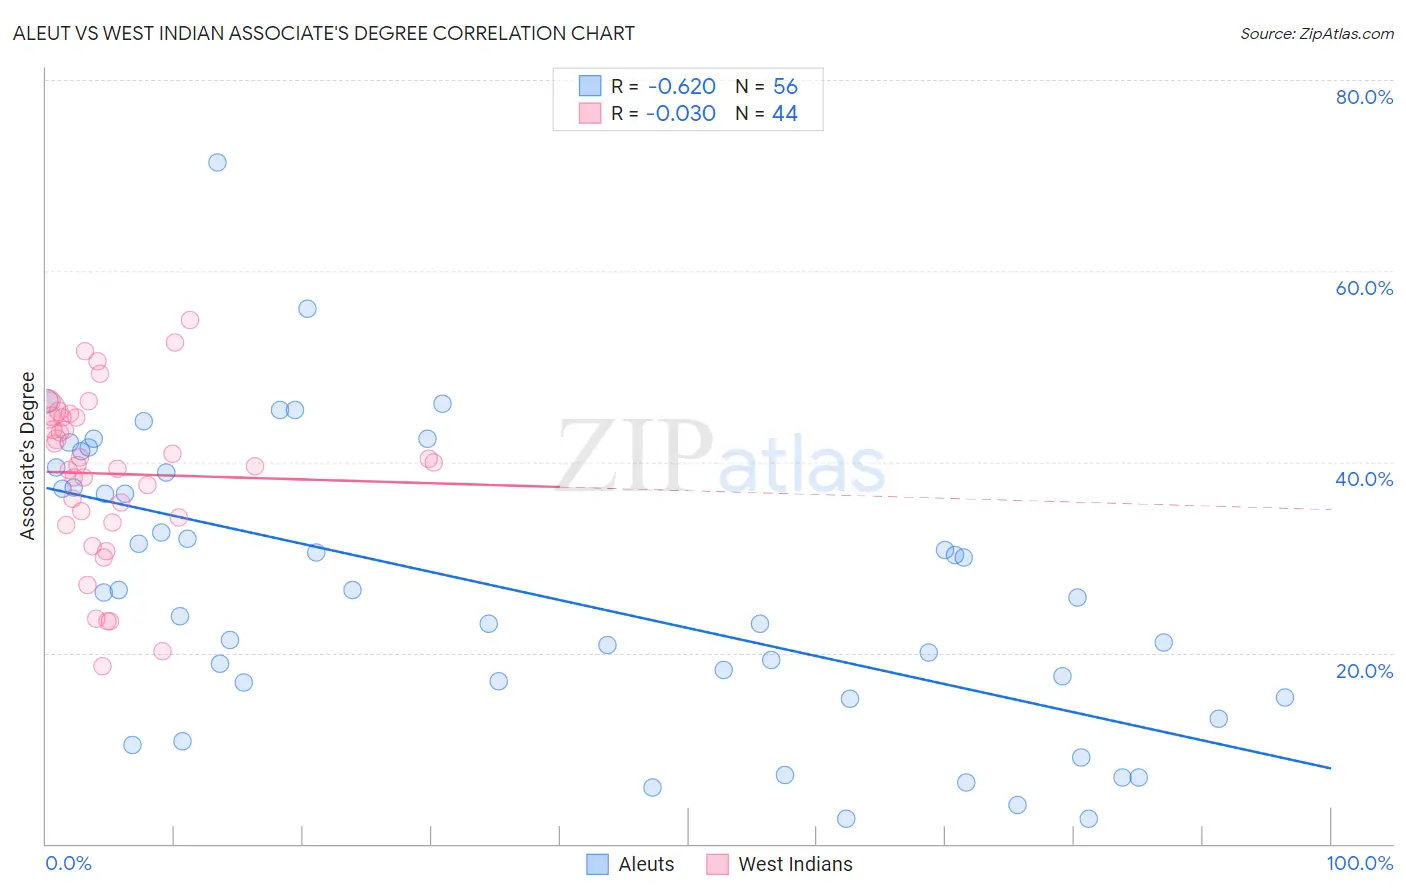
Aleut vs West Indian Associate's Degree Correlation Chart
The statistical analysis conducted on geographies consisting of 61,782,803 people shows a significant negative correlation between the proportion of Aleuts and percentage of population with at least associate's degree education in the United States with a correlation coefficient (R) of -0.620 and weighted average of 39.6%. Similarly, the statistical analysis conducted on geographies consisting of 254,053,499 people shows no correlation between the proportion of West Indians and percentage of population with at least associate's degree education in the United States with a correlation coefficient (R) of -0.030 and weighted average of 43.8%, a difference of 10.6%.
Associate's Degree Correlation Summary
| Measurement | Aleut | West Indian |
| Minimum | 2.6% | 18.6% |
| Maximum | 71.3% | 54.9% |
| Range | 68.7% | 36.3% |
| Mean | 26.6% | 38.7% |
| Median | 26.0% | 39.8% |
| Interquartile 25% (IQ1) | 16.1% | 33.9% |
| Interquartile 75% (IQ3) | 38.1% | 44.7% |
| Interquartile Range (IQR) | 22.0% | 10.8% |
| Standard Deviation (Sample) | 14.9% | 8.6% |
| Standard Deviation (Population) | 14.8% | 8.5% |
Similar Demographics by Associate's Degree
Demographics Similar to Aleuts by Associate's Degree
In terms of associate's degree, the demographic groups most similar to Aleuts are Immigrants from Cuba (39.5%, a difference of 0.24%), Immigrants from Caribbean (39.7%, a difference of 0.26%), Central American (39.4%, a difference of 0.50%), Immigrants from Belize (39.9%, a difference of 0.60%), and Comanche (39.9%, a difference of 0.70%).
| Demographics | Rating | Rank | Associate's Degree |
| Immigrants | Micronesia | 0.1 /100 | #280 | Tragic 40.2% |
| Immigrants | Portugal | 0.1 /100 | #281 | Tragic 40.1% |
| Bangladeshis | 0.1 /100 | #282 | Tragic 40.0% |
| Haitians | 0.1 /100 | #283 | Tragic 40.0% |
| Comanche | 0.1 /100 | #284 | Tragic 39.9% |
| Immigrants | Belize | 0.1 /100 | #285 | Tragic 39.9% |
| Immigrants | Caribbean | 0.0 /100 | #286 | Tragic 39.7% |
| Aleuts | 0.0 /100 | #287 | Tragic 39.6% |
| Immigrants | Cuba | 0.0 /100 | #288 | Tragic 39.5% |
| Central Americans | 0.0 /100 | #289 | Tragic 39.4% |
| Immigrants | Haiti | 0.0 /100 | #290 | Tragic 39.3% |
| Dominicans | 0.0 /100 | #291 | Tragic 39.3% |
| Blacks/African Americans | 0.0 /100 | #292 | Tragic 39.1% |
| Nepalese | 0.0 /100 | #293 | Tragic 39.0% |
| Salvadorans | 0.0 /100 | #294 | Tragic 39.0% |
Demographics Similar to West Indians by Associate's Degree
In terms of associate's degree, the demographic groups most similar to West Indians are Subsaharan African (43.9%, a difference of 0.14%), Guamanian/Chamorro (43.8%, a difference of 0.15%), Barbadian (43.9%, a difference of 0.24%), Immigrants from Burma/Myanmar (43.7%, a difference of 0.37%), and Immigrants from Western Africa (44.1%, a difference of 0.51%).
| Demographics | Rating | Rank | Associate's Degree |
| Immigrants | Immigrants | 10.5 /100 | #217 | Poor 44.5% |
| Spanish | 9.4 /100 | #218 | Tragic 44.4% |
| Whites/Caucasians | 7.5 /100 | #219 | Tragic 44.2% |
| Portuguese | 7.2 /100 | #220 | Tragic 44.1% |
| Immigrants | Western Africa | 6.6 /100 | #221 | Tragic 44.1% |
| Barbadians | 5.8 /100 | #222 | Tragic 43.9% |
| Sub-Saharan Africans | 5.5 /100 | #223 | Tragic 43.9% |
| West Indians | 5.2 /100 | #224 | Tragic 43.8% |
| Guamanians/Chamorros | 4.8 /100 | #225 | Tragic 43.8% |
| Immigrants | Burma/Myanmar | 4.3 /100 | #226 | Tragic 43.7% |
| Trinidadians and Tobagonians | 4.0 /100 | #227 | Tragic 43.6% |
| Hmong | 3.2 /100 | #228 | Tragic 43.4% |
| Immigrants | Trinidad and Tobago | 3.0 /100 | #229 | Tragic 43.3% |
| Immigrants | Barbados | 2.9 /100 | #230 | Tragic 43.3% |
| Liberians | 2.9 /100 | #231 | Tragic 43.3% |