Apache vs Uruguayan Bachelor's Degree
COMPARE
Apache
Uruguayan
Bachelor's Degree
Bachelor's Degree Comparison
Apache
Uruguayans
28.3%
BACHELOR'S DEGREE
0.0/ 100
METRIC RATING
326th/ 347
METRIC RANK
38.4%
BACHELOR'S DEGREE
65.8/ 100
METRIC RATING
161st/ 347
METRIC RANK
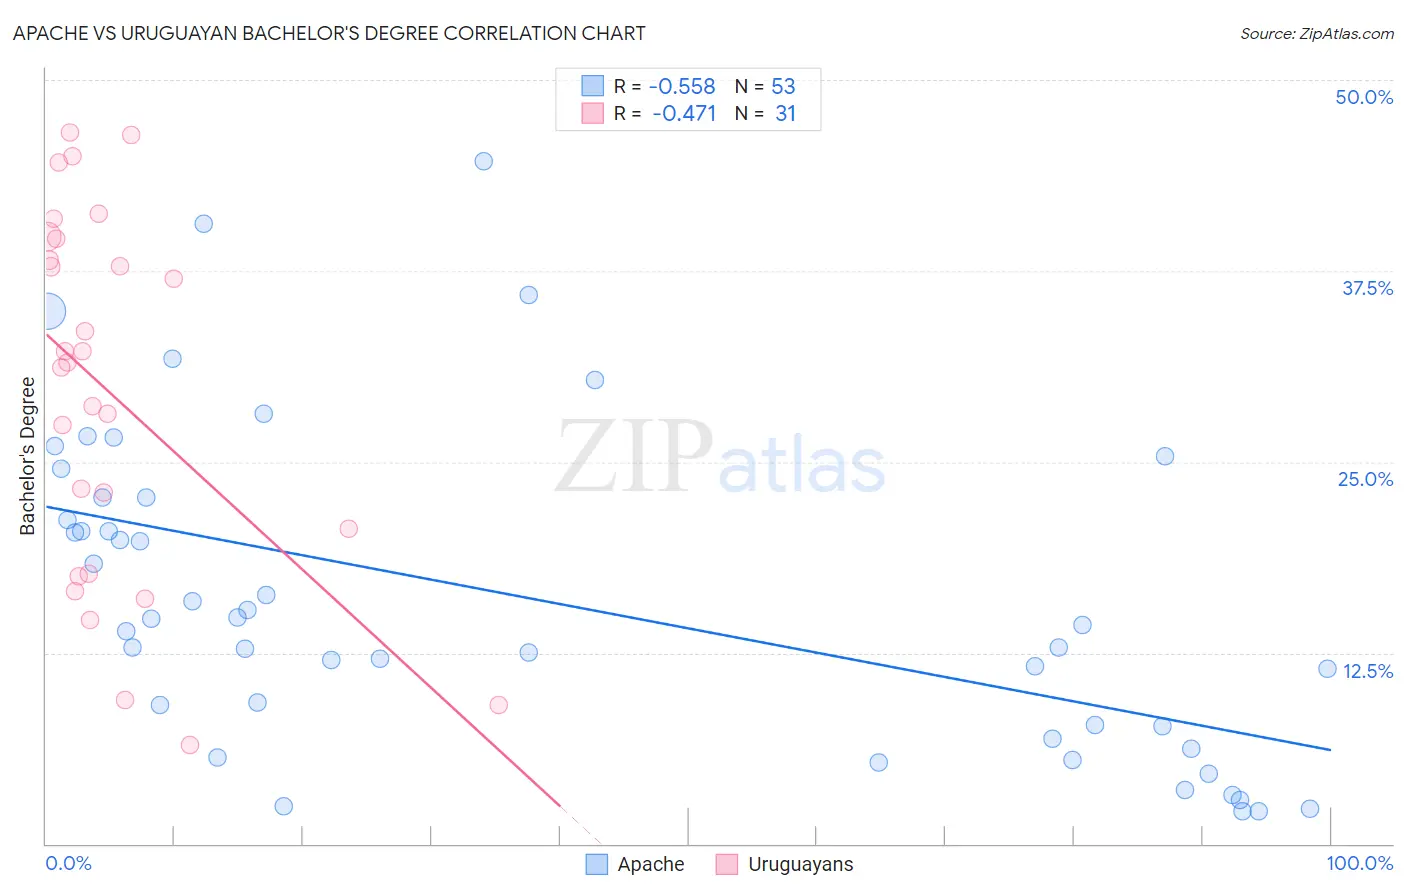
Apache vs Uruguayan Bachelor's Degree Correlation Chart
The statistical analysis conducted on geographies consisting of 231,132,422 people shows a substantial negative correlation between the proportion of Apache and percentage of population with at least bachelor's degree education in the United States with a correlation coefficient (R) of -0.558 and weighted average of 28.3%. Similarly, the statistical analysis conducted on geographies consisting of 144,782,470 people shows a moderate negative correlation between the proportion of Uruguayans and percentage of population with at least bachelor's degree education in the United States with a correlation coefficient (R) of -0.471 and weighted average of 38.4%, a difference of 35.9%.
Bachelor's Degree Correlation Summary
| Measurement | Apache | Uruguayan |
| Minimum | 2.1% | 6.5% |
| Maximum | 44.7% | 46.6% |
| Range | 42.5% | 40.1% |
| Mean | 16.1% | 29.5% |
| Median | 14.3% | 31.5% |
| Interquartile 25% (IQ1) | 7.3% | 17.7% |
| Interquartile 75% (IQ3) | 22.7% | 39.6% |
| Interquartile Range (IQR) | 15.4% | 21.9% |
| Standard Deviation (Sample) | 10.5% | 11.8% |
| Standard Deviation (Population) | 10.4% | 11.6% |
Similar Demographics by Bachelor's Degree
Demographics Similar to Apache by Bachelor's Degree
In terms of bachelor's degree, the demographic groups most similar to Apache are Pennsylvania German (28.4%, a difference of 0.39%), Paiute (28.1%, a difference of 0.67%), Dutch West Indian (28.5%, a difference of 0.84%), Fijian (28.7%, a difference of 1.6%), and Tsimshian (28.8%, a difference of 1.7%).
| Demographics | Rating | Rank | Bachelor's Degree |
| Creek | 0.0 /100 | #319 | Tragic 28.9% |
| Kiowa | 0.0 /100 | #320 | Tragic 28.8% |
| Alaskan Athabascans | 0.0 /100 | #321 | Tragic 28.8% |
| Tsimshian | 0.0 /100 | #322 | Tragic 28.8% |
| Fijians | 0.0 /100 | #323 | Tragic 28.7% |
| Dutch West Indians | 0.0 /100 | #324 | Tragic 28.5% |
| Pennsylvania Germans | 0.0 /100 | #325 | Tragic 28.4% |
| Apache | 0.0 /100 | #326 | Tragic 28.3% |
| Paiute | 0.0 /100 | #327 | Tragic 28.1% |
| Crow | 0.0 /100 | #328 | Tragic 27.7% |
| Immigrants | Central America | 0.0 /100 | #329 | Tragic 27.5% |
| Spanish American Indians | 0.0 /100 | #330 | Tragic 27.5% |
| Immigrants | Azores | 0.0 /100 | #331 | Tragic 27.3% |
| Menominee | 0.0 /100 | #332 | Tragic 27.3% |
| Mexicans | 0.0 /100 | #333 | Tragic 27.1% |
Demographics Similar to Uruguayans by Bachelor's Degree
In terms of bachelor's degree, the demographic groups most similar to Uruguayans are Vietnamese (38.5%, a difference of 0.080%), Colombian (38.4%, a difference of 0.080%), Chinese (38.5%, a difference of 0.090%), Peruvian (38.3%, a difference of 0.25%), and Hungarian (38.3%, a difference of 0.38%).
| Demographics | Rating | Rank | Bachelor's Degree |
| Canadians | 75.0 /100 | #154 | Good 38.8% |
| Immigrants | Kenya | 73.8 /100 | #155 | Good 38.8% |
| Kenyans | 72.5 /100 | #156 | Good 38.7% |
| Immigrants | South America | 70.1 /100 | #157 | Good 38.6% |
| Immigrants | Germany | 69.6 /100 | #158 | Good 38.6% |
| Chinese | 66.6 /100 | #159 | Good 38.5% |
| Vietnamese | 66.6 /100 | #160 | Good 38.5% |
| Uruguayans | 65.8 /100 | #161 | Good 38.4% |
| Colombians | 65.0 /100 | #162 | Good 38.4% |
| Peruvians | 63.4 /100 | #163 | Good 38.3% |
| Hungarians | 62.1 /100 | #164 | Good 38.3% |
| Sri Lankans | 59.1 /100 | #165 | Average 38.2% |
| Somalis | 58.6 /100 | #166 | Average 38.1% |
| Scottish | 56.6 /100 | #167 | Average 38.1% |
| Danes | 56.2 /100 | #168 | Average 38.1% |