Immigrants from Sierra Leone vs Uruguayan High School Diploma
COMPARE
Immigrants from Sierra Leone
Uruguayan
High School Diploma
High School Diploma Comparison
Immigrants from Sierra Leone
Uruguayans
88.6%
HIGH SCHOOL DIPLOMA
15.8/ 100
METRIC RATING
207th/ 347
METRIC RANK
88.2%
HIGH SCHOOL DIPLOMA
5.6/ 100
METRIC RATING
226th/ 347
METRIC RANK
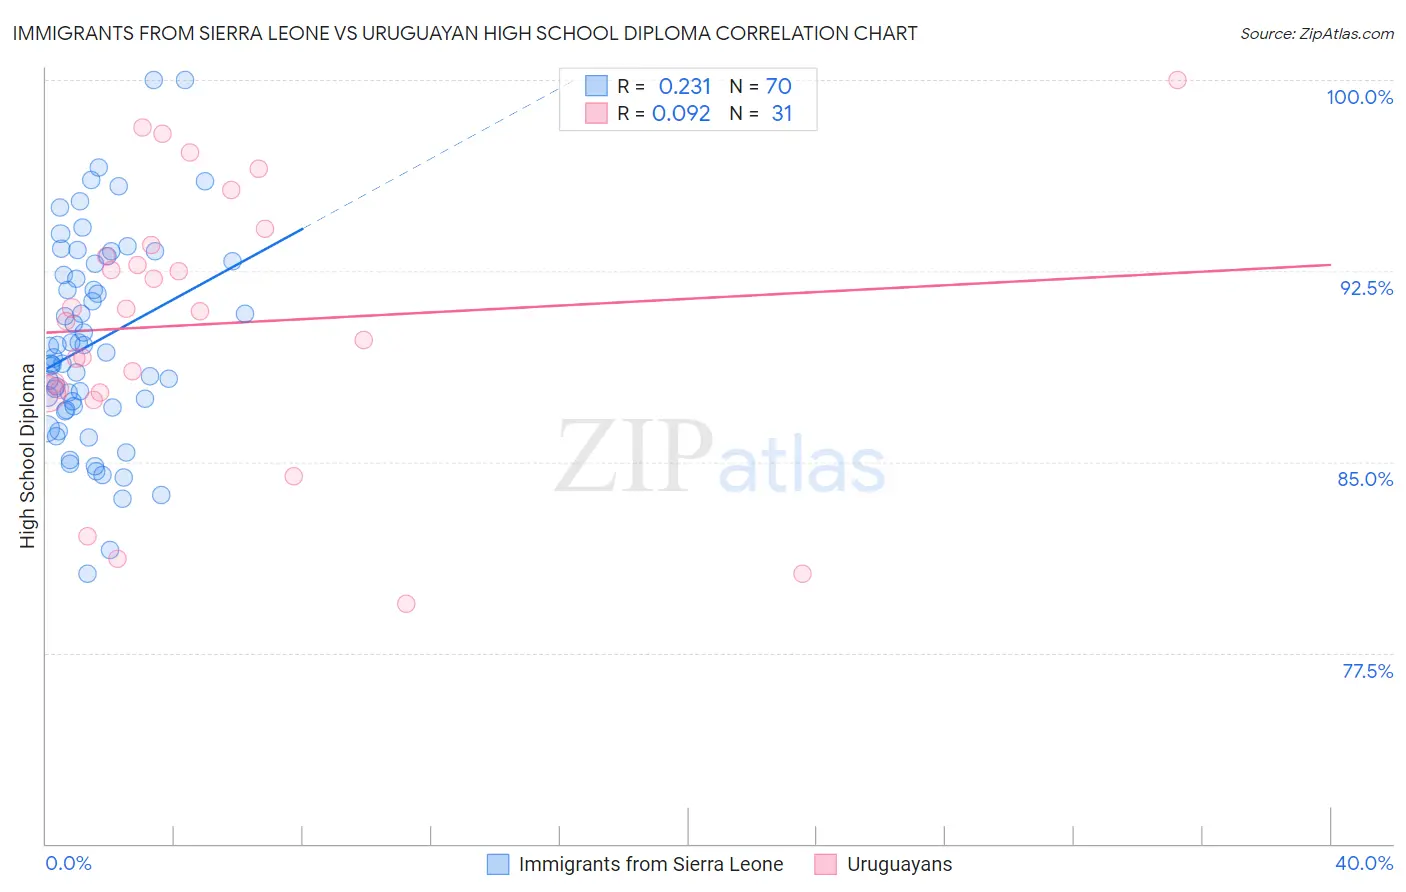
Immigrants from Sierra Leone vs Uruguayan High School Diploma Correlation Chart
The statistical analysis conducted on geographies consisting of 101,634,956 people shows a weak positive correlation between the proportion of Immigrants from Sierra Leone and percentage of population with at least high school diploma education in the United States with a correlation coefficient (R) of 0.231 and weighted average of 88.6%. Similarly, the statistical analysis conducted on geographies consisting of 144,782,615 people shows a slight positive correlation between the proportion of Uruguayans and percentage of population with at least high school diploma education in the United States with a correlation coefficient (R) of 0.092 and weighted average of 88.2%, a difference of 0.43%.
High School Diploma Correlation Summary
| Measurement | Immigrants from Sierra Leone | Uruguayan |
| Minimum | 80.6% | 79.4% |
| Maximum | 100.0% | 100.0% |
| Range | 19.4% | 20.6% |
| Mean | 89.7% | 90.4% |
| Median | 89.2% | 90.9% |
| Interquartile 25% (IQ1) | 87.1% | 87.7% |
| Interquartile 75% (IQ3) | 92.8% | 93.5% |
| Interquartile Range (IQR) | 5.6% | 5.8% |
| Standard Deviation (Sample) | 4.0% | 5.2% |
| Standard Deviation (Population) | 4.0% | 5.1% |
Demographics Similar to Immigrants from Sierra Leone and Uruguayans by High School Diploma
In terms of high school diploma, the demographic groups most similar to Immigrants from Sierra Leone are Arapaho (88.6%, a difference of 0.010%), Portuguese (88.5%, a difference of 0.040%), Cherokee (88.5%, a difference of 0.040%), Samoan (88.5%, a difference of 0.050%), and Inupiat (88.5%, a difference of 0.080%). Similarly, the demographic groups most similar to Uruguayans are Creek (88.3%, a difference of 0.080%), Shoshone (88.3%, a difference of 0.090%), Immigrants from Zaire (88.3%, a difference of 0.12%), Colville (88.3%, a difference of 0.13%), and Immigrants from Afghanistan (88.3%, a difference of 0.17%).
| Demographics | Rating | Rank | High School Diploma |
| Arapaho | 16.1 /100 | #206 | Poor 88.6% |
| Immigrants | Sierra Leone | 15.8 /100 | #207 | Poor 88.6% |
| Portuguese | 14.4 /100 | #208 | Poor 88.5% |
| Cherokee | 14.3 /100 | #209 | Poor 88.5% |
| Samoans | 14.0 /100 | #210 | Poor 88.5% |
| Inupiat | 13.1 /100 | #211 | Poor 88.5% |
| South American Indians | 12.2 /100 | #212 | Poor 88.5% |
| Immigrants | Somalia | 11.3 /100 | #213 | Poor 88.4% |
| Immigrants | Cameroon | 10.9 /100 | #214 | Poor 88.4% |
| Crow | 10.9 /100 | #215 | Poor 88.4% |
| Chickasaw | 10.7 /100 | #216 | Poor 88.4% |
| Immigrants | Africa | 10.6 /100 | #217 | Poor 88.4% |
| Immigrants | Bolivia | 10.3 /100 | #218 | Poor 88.4% |
| Costa Ricans | 9.6 /100 | #219 | Tragic 88.4% |
| Tongans | 9.5 /100 | #220 | Tragic 88.4% |
| Immigrants | Afghanistan | 8.6 /100 | #221 | Tragic 88.3% |
| Colville | 7.8 /100 | #222 | Tragic 88.3% |
| Immigrants | Zaire | 7.6 /100 | #223 | Tragic 88.3% |
| Shoshone | 7.0 /100 | #224 | Tragic 88.3% |
| Creek | 6.9 /100 | #225 | Tragic 88.3% |
| Uruguayans | 5.6 /100 | #226 | Tragic 88.2% |