Celtic vs Uruguayan High School Diploma
COMPARE
Celtic
Uruguayan
High School Diploma
High School Diploma Comparison
Celtics
Uruguayans
90.6%
HIGH SCHOOL DIPLOMA
98.7/ 100
METRIC RATING
90th/ 347
METRIC RANK
88.2%
HIGH SCHOOL DIPLOMA
5.6/ 100
METRIC RATING
226th/ 347
METRIC RANK
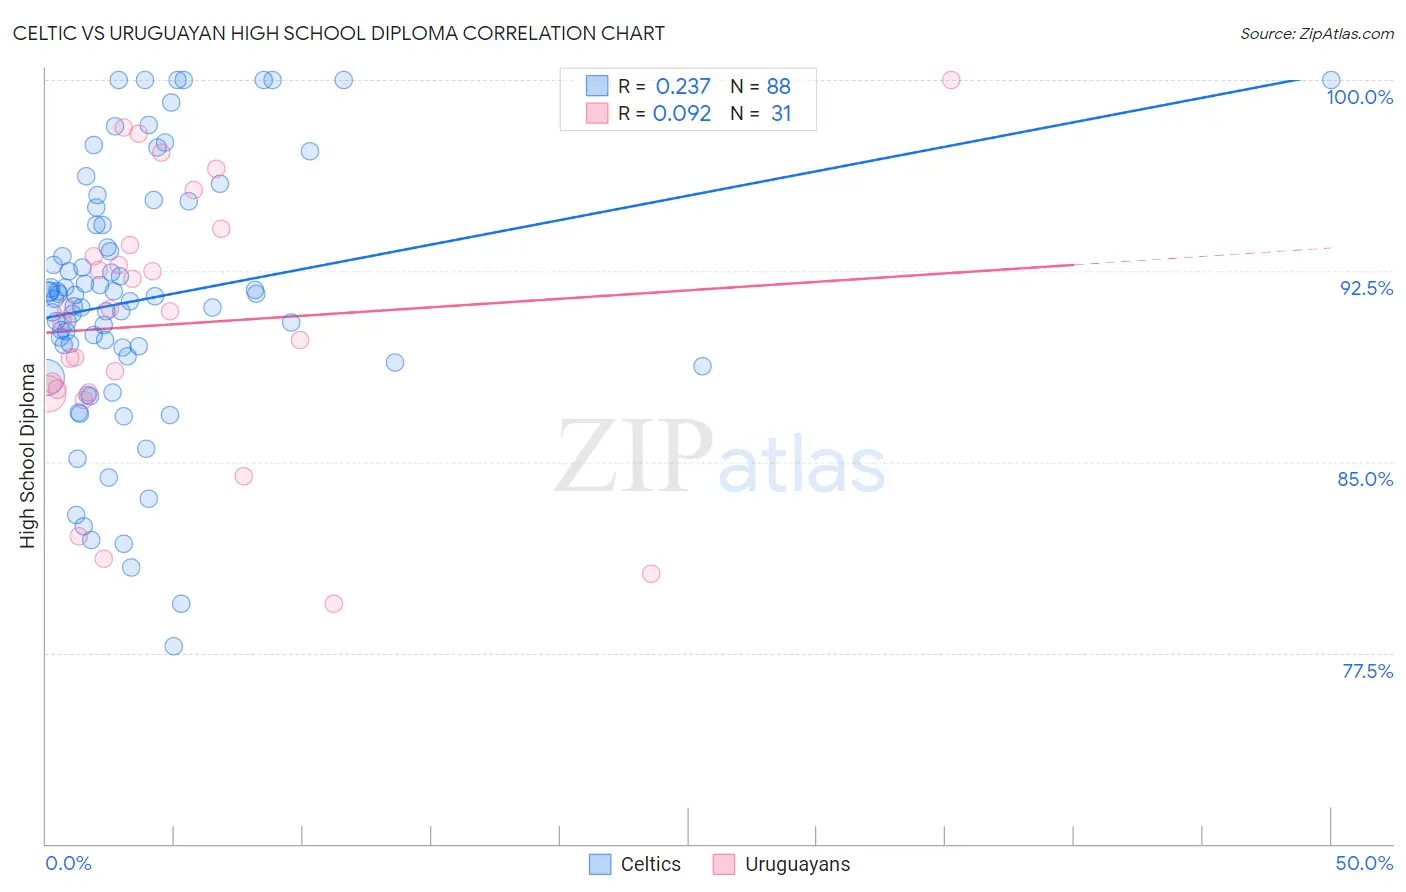
Celtic vs Uruguayan High School Diploma Correlation Chart
The statistical analysis conducted on geographies consisting of 168,876,981 people shows a weak positive correlation between the proportion of Celtics and percentage of population with at least high school diploma education in the United States with a correlation coefficient (R) of 0.237 and weighted average of 90.6%. Similarly, the statistical analysis conducted on geographies consisting of 144,782,615 people shows a slight positive correlation between the proportion of Uruguayans and percentage of population with at least high school diploma education in the United States with a correlation coefficient (R) of 0.092 and weighted average of 88.2%, a difference of 2.7%.
High School Diploma Correlation Summary
| Measurement | Celtic | Uruguayan |
| Minimum | 77.8% | 79.4% |
| Maximum | 100.0% | 100.0% |
| Range | 22.2% | 20.6% |
| Mean | 91.4% | 90.4% |
| Median | 91.4% | 90.9% |
| Interquartile 25% (IQ1) | 89.3% | 87.7% |
| Interquartile 75% (IQ3) | 94.3% | 93.5% |
| Interquartile Range (IQR) | 5.0% | 5.8% |
| Standard Deviation (Sample) | 5.0% | 5.2% |
| Standard Deviation (Population) | 5.0% | 5.1% |
Similar Demographics by High School Diploma
Demographics Similar to Celtics by High School Diploma
In terms of high school diploma, the demographic groups most similar to Celtics are Canadian (90.6%, a difference of 0.010%), South African (90.6%, a difference of 0.020%), Immigrants from France (90.6%, a difference of 0.030%), Swiss (90.6%, a difference of 0.030%), and Immigrants from Western Europe (90.6%, a difference of 0.040%).
| Demographics | Rating | Rank | High School Diploma |
| Immigrants | Moldova | 99.2 /100 | #83 | Exceptional 90.7% |
| Immigrants | Saudi Arabia | 99.1 /100 | #84 | Exceptional 90.7% |
| Romanians | 98.9 /100 | #85 | Exceptional 90.7% |
| Immigrants | Bulgaria | 98.9 /100 | #86 | Exceptional 90.6% |
| Immigrants | Turkey | 98.9 /100 | #87 | Exceptional 90.6% |
| Immigrants | France | 98.8 /100 | #88 | Exceptional 90.6% |
| Canadians | 98.7 /100 | #89 | Exceptional 90.6% |
| Celtics | 98.7 /100 | #90 | Exceptional 90.6% |
| South Africans | 98.6 /100 | #91 | Exceptional 90.6% |
| Swiss | 98.6 /100 | #92 | Exceptional 90.6% |
| Immigrants | Western Europe | 98.6 /100 | #93 | Exceptional 90.6% |
| Immigrants | Israel | 98.5 /100 | #94 | Exceptional 90.5% |
| Icelanders | 98.5 /100 | #95 | Exceptional 90.5% |
| Immigrants | Serbia | 98.4 /100 | #96 | Exceptional 90.5% |
| Immigrants | Kuwait | 98.3 /100 | #97 | Exceptional 90.5% |
Demographics Similar to Uruguayans by High School Diploma
In terms of high school diploma, the demographic groups most similar to Uruguayans are Immigrants from Liberia (88.2%, a difference of 0.010%), Kiowa (88.2%, a difference of 0.020%), Nigerian (88.2%, a difference of 0.030%), Creek (88.3%, a difference of 0.080%), and Shoshone (88.3%, a difference of 0.090%).
| Demographics | Rating | Rank | High School Diploma |
| Costa Ricans | 9.6 /100 | #219 | Tragic 88.4% |
| Tongans | 9.5 /100 | #220 | Tragic 88.4% |
| Immigrants | Afghanistan | 8.6 /100 | #221 | Tragic 88.3% |
| Colville | 7.8 /100 | #222 | Tragic 88.3% |
| Immigrants | Zaire | 7.6 /100 | #223 | Tragic 88.3% |
| Shoshone | 7.0 /100 | #224 | Tragic 88.3% |
| Creek | 6.9 /100 | #225 | Tragic 88.3% |
| Uruguayans | 5.6 /100 | #226 | Tragic 88.2% |
| Immigrants | Liberia | 5.5 /100 | #227 | Tragic 88.2% |
| Kiowa | 5.3 /100 | #228 | Tragic 88.2% |
| Nigerians | 5.2 /100 | #229 | Tragic 88.2% |
| Blackfeet | 4.2 /100 | #230 | Tragic 88.1% |
| Colombians | 3.8 /100 | #231 | Tragic 88.1% |
| Immigrants | Middle Africa | 3.4 /100 | #232 | Tragic 88.0% |
| Immigrants | Panama | 3.1 /100 | #233 | Tragic 88.0% |