Bulgarian vs Afghan High School Diploma
COMPARE
Bulgarian
Afghan
High School Diploma
High School Diploma Comparison
Bulgarians
Afghans
91.8%
HIGH SCHOOL DIPLOMA
100.0/ 100
METRIC RATING
14th/ 347
METRIC RANK
88.8%
HIGH SCHOOL DIPLOMA
23.9/ 100
METRIC RATING
195th/ 347
METRIC RANK
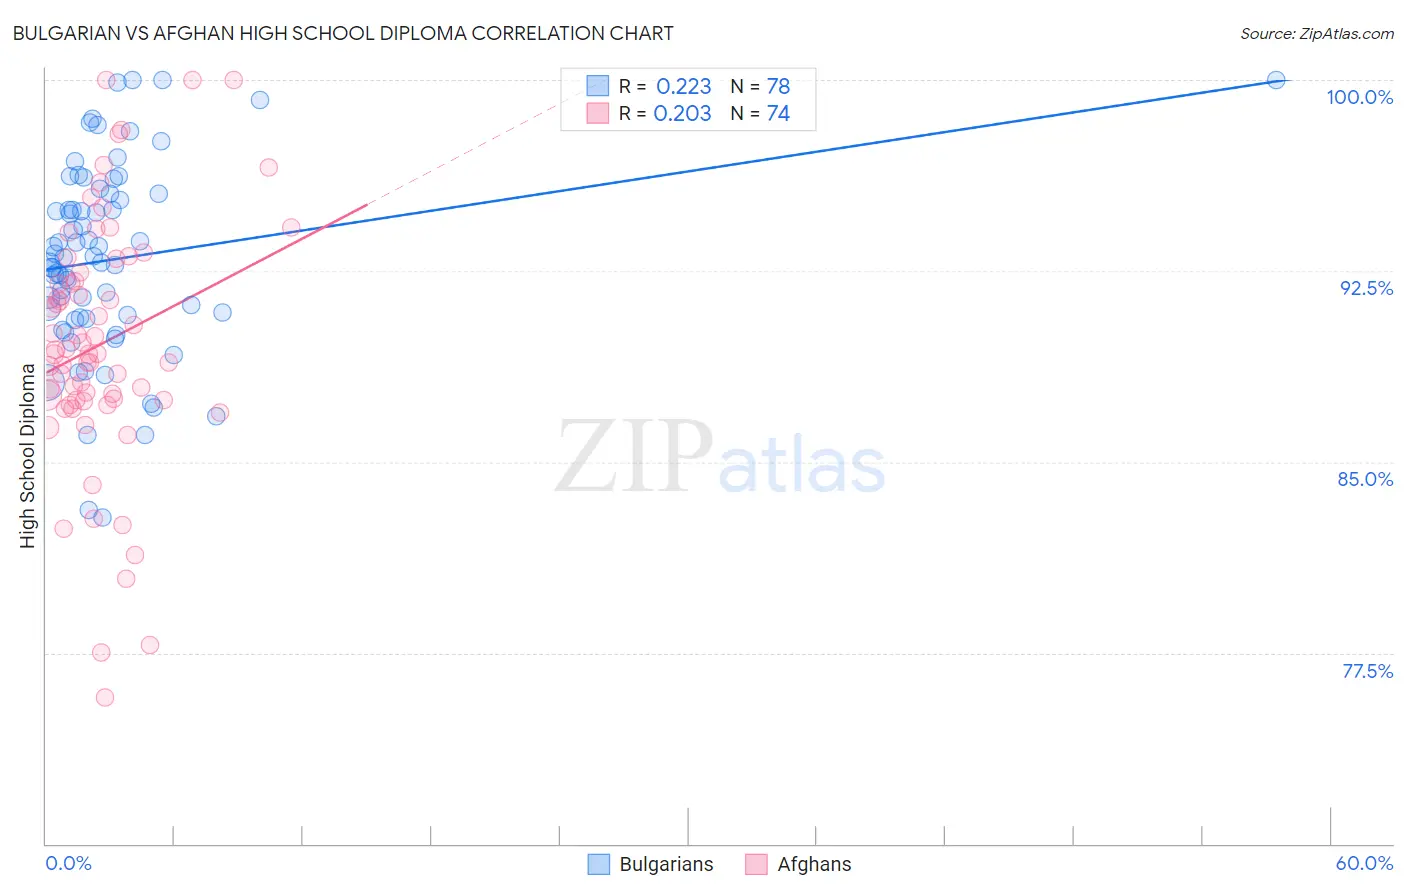
Bulgarian vs Afghan High School Diploma Correlation Chart
The statistical analysis conducted on geographies consisting of 205,633,404 people shows a weak positive correlation between the proportion of Bulgarians and percentage of population with at least high school diploma education in the United States with a correlation coefficient (R) of 0.223 and weighted average of 91.8%. Similarly, the statistical analysis conducted on geographies consisting of 148,851,685 people shows a weak positive correlation between the proportion of Afghans and percentage of population with at least high school diploma education in the United States with a correlation coefficient (R) of 0.203 and weighted average of 88.8%, a difference of 3.4%.
High School Diploma Correlation Summary
| Measurement | Bulgarian | Afghan |
| Minimum | 82.8% | 75.7% |
| Maximum | 100.0% | 100.0% |
| Range | 17.2% | 24.3% |
| Mean | 93.0% | 89.6% |
| Median | 92.9% | 89.2% |
| Interquartile 25% (IQ1) | 90.7% | 87.4% |
| Interquartile 75% (IQ3) | 95.5% | 92.4% |
| Interquartile Range (IQR) | 4.9% | 5.0% |
| Standard Deviation (Sample) | 3.8% | 4.9% |
| Standard Deviation (Population) | 3.7% | 4.9% |
Similar Demographics by High School Diploma
Demographics Similar to Bulgarians by High School Diploma
In terms of high school diploma, the demographic groups most similar to Bulgarians are Luxembourger (91.7%, a difference of 0.030%), Danish (91.8%, a difference of 0.050%), Finnish (91.7%, a difference of 0.050%), Immigrants from Singapore (91.7%, a difference of 0.090%), and Polish (91.9%, a difference of 0.10%).
| Demographics | Rating | Rank | High School Diploma |
| Immigrants | India | 100.0 /100 | #7 | Exceptional 92.0% |
| Chinese | 100.0 /100 | #8 | Exceptional 92.0% |
| Latvians | 100.0 /100 | #9 | Exceptional 92.0% |
| Croatians | 100.0 /100 | #10 | Exceptional 92.0% |
| Eastern Europeans | 100.0 /100 | #11 | Exceptional 91.9% |
| Poles | 100.0 /100 | #12 | Exceptional 91.9% |
| Danes | 100.0 /100 | #13 | Exceptional 91.8% |
| Bulgarians | 100.0 /100 | #14 | Exceptional 91.8% |
| Luxembourgers | 100.0 /100 | #15 | Exceptional 91.7% |
| Finns | 100.0 /100 | #16 | Exceptional 91.7% |
| Immigrants | Singapore | 99.9 /100 | #17 | Exceptional 91.7% |
| Germans | 99.9 /100 | #18 | Exceptional 91.7% |
| Maltese | 99.9 /100 | #19 | Exceptional 91.6% |
| Czechs | 99.9 /100 | #20 | Exceptional 91.6% |
| Filipinos | 99.9 /100 | #21 | Exceptional 91.6% |
Demographics Similar to Afghans by High School Diploma
In terms of high school diploma, the demographic groups most similar to Afghans are Immigrants from Southern Europe (88.7%, a difference of 0.010%), Immigrants from Venezuela (88.8%, a difference of 0.040%), French American Indian (88.7%, a difference of 0.050%), Immigrants from Oceania (88.8%, a difference of 0.060%), and Moroccan (88.8%, a difference of 0.11%).
| Demographics | Rating | Rank | High School Diploma |
| Immigrants | Sudan | 33.4 /100 | #188 | Fair 88.9% |
| Immigrants | Uganda | 32.6 /100 | #189 | Fair 88.9% |
| Immigrants | Chile | 31.9 /100 | #190 | Fair 88.9% |
| Immigrants | Ethiopia | 30.9 /100 | #191 | Fair 88.9% |
| Moroccans | 29.5 /100 | #192 | Fair 88.8% |
| Immigrants | Oceania | 26.9 /100 | #193 | Fair 88.8% |
| Immigrants | Venezuela | 25.8 /100 | #194 | Fair 88.8% |
| Afghans | 23.9 /100 | #195 | Fair 88.8% |
| Immigrants | Southern Europe | 23.4 /100 | #196 | Fair 88.7% |
| French American Indians | 21.5 /100 | #197 | Fair 88.7% |
| Liberians | 18.8 /100 | #198 | Poor 88.7% |
| Marshallese | 18.7 /100 | #199 | Poor 88.6% |
| Hawaiians | 18.3 /100 | #200 | Poor 88.6% |
| Koreans | 18.1 /100 | #201 | Poor 88.6% |
| Panamanians | 18.0 /100 | #202 | Poor 88.6% |