Iranian vs Afghan High School Diploma
COMPARE
Iranian
Afghan
High School Diploma
High School Diploma Comparison
Iranians
Afghans
91.4%
HIGH SCHOOL DIPLOMA
99.9/ 100
METRIC RATING
30th/ 347
METRIC RANK
88.8%
HIGH SCHOOL DIPLOMA
23.9/ 100
METRIC RATING
195th/ 347
METRIC RANK
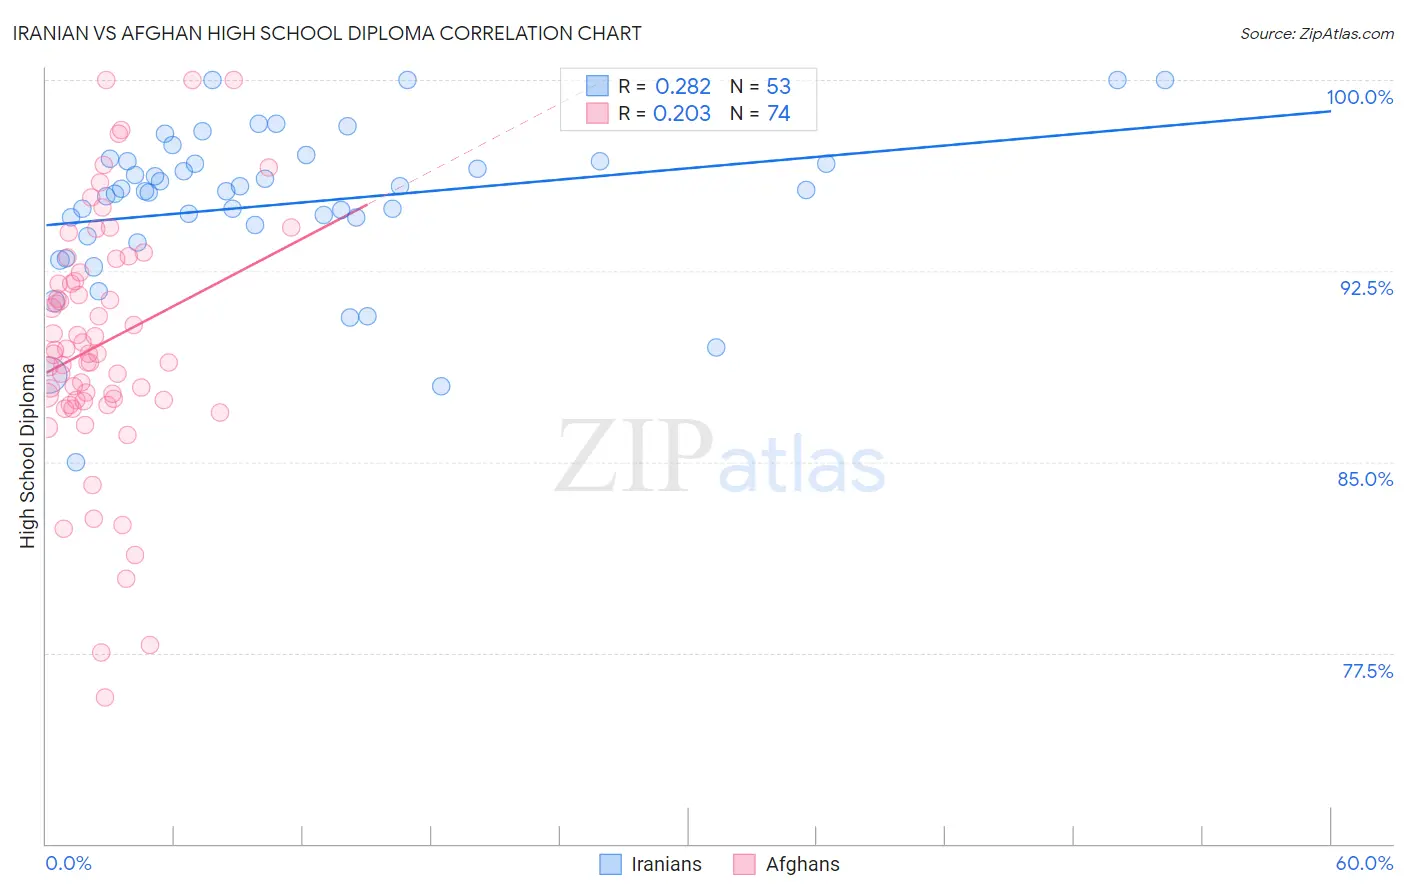
Iranian vs Afghan High School Diploma Correlation Chart
The statistical analysis conducted on geographies consisting of 316,901,778 people shows a weak positive correlation between the proportion of Iranians and percentage of population with at least high school diploma education in the United States with a correlation coefficient (R) of 0.282 and weighted average of 91.4%. Similarly, the statistical analysis conducted on geographies consisting of 148,851,685 people shows a weak positive correlation between the proportion of Afghans and percentage of population with at least high school diploma education in the United States with a correlation coefficient (R) of 0.203 and weighted average of 88.8%, a difference of 3.0%.
High School Diploma Correlation Summary
| Measurement | Iranian | Afghan |
| Minimum | 85.0% | 75.7% |
| Maximum | 100.0% | 100.0% |
| Range | 15.0% | 24.3% |
| Mean | 95.1% | 89.6% |
| Median | 95.6% | 89.2% |
| Interquartile 25% (IQ1) | 94.1% | 87.4% |
| Interquartile 75% (IQ3) | 96.8% | 92.4% |
| Interquartile Range (IQR) | 2.7% | 5.0% |
| Standard Deviation (Sample) | 3.1% | 4.9% |
| Standard Deviation (Population) | 3.0% | 4.9% |
Similar Demographics by High School Diploma
Demographics Similar to Iranians by High School Diploma
In terms of high school diploma, the demographic groups most similar to Iranians are European (91.4%, a difference of 0.010%), Immigrants from Northern Europe (91.4%, a difference of 0.010%), English (91.4%, a difference of 0.010%), Okinawan (91.4%, a difference of 0.010%), and Scottish (91.4%, a difference of 0.020%).
| Demographics | Rating | Rank | High School Diploma |
| Scandinavians | 99.9 /100 | #23 | Exceptional 91.5% |
| Italians | 99.9 /100 | #24 | Exceptional 91.5% |
| Thais | 99.9 /100 | #25 | Exceptional 91.5% |
| Russians | 99.9 /100 | #26 | Exceptional 91.5% |
| Cypriots | 99.9 /100 | #27 | Exceptional 91.5% |
| Tlingit-Haida | 99.9 /100 | #28 | Exceptional 91.4% |
| Europeans | 99.9 /100 | #29 | Exceptional 91.4% |
| Iranians | 99.9 /100 | #30 | Exceptional 91.4% |
| Immigrants | Northern Europe | 99.9 /100 | #31 | Exceptional 91.4% |
| English | 99.9 /100 | #32 | Exceptional 91.4% |
| Okinawans | 99.9 /100 | #33 | Exceptional 91.4% |
| Scottish | 99.9 /100 | #34 | Exceptional 91.4% |
| Irish | 99.9 /100 | #35 | Exceptional 91.4% |
| Tsimshian | 99.9 /100 | #36 | Exceptional 91.3% |
| Immigrants | Ireland | 99.9 /100 | #37 | Exceptional 91.3% |
Demographics Similar to Afghans by High School Diploma
In terms of high school diploma, the demographic groups most similar to Afghans are Immigrants from Southern Europe (88.7%, a difference of 0.010%), Immigrants from Venezuela (88.8%, a difference of 0.040%), French American Indian (88.7%, a difference of 0.050%), Immigrants from Oceania (88.8%, a difference of 0.060%), and Moroccan (88.8%, a difference of 0.11%).
| Demographics | Rating | Rank | High School Diploma |
| Immigrants | Sudan | 33.4 /100 | #188 | Fair 88.9% |
| Immigrants | Uganda | 32.6 /100 | #189 | Fair 88.9% |
| Immigrants | Chile | 31.9 /100 | #190 | Fair 88.9% |
| Immigrants | Ethiopia | 30.9 /100 | #191 | Fair 88.9% |
| Moroccans | 29.5 /100 | #192 | Fair 88.8% |
| Immigrants | Oceania | 26.9 /100 | #193 | Fair 88.8% |
| Immigrants | Venezuela | 25.8 /100 | #194 | Fair 88.8% |
| Afghans | 23.9 /100 | #195 | Fair 88.8% |
| Immigrants | Southern Europe | 23.4 /100 | #196 | Fair 88.7% |
| French American Indians | 21.5 /100 | #197 | Fair 88.7% |
| Liberians | 18.8 /100 | #198 | Poor 88.7% |
| Marshallese | 18.7 /100 | #199 | Poor 88.6% |
| Hawaiians | 18.3 /100 | #200 | Poor 88.6% |
| Koreans | 18.1 /100 | #201 | Poor 88.6% |
| Panamanians | 18.0 /100 | #202 | Poor 88.6% |