Maltese vs Pima GED/Equivalency
COMPARE
Maltese
Pima
GED/Equivalency
GED/Equivalency Comparison
Maltese
Pima
88.6%
GED/EQUIVALENCY
99.9/ 100
METRIC RATING
20th/ 347
METRIC RANK
76.4%
GED/EQUIVALENCY
0.0/ 100
METRIC RATING
342nd/ 347
METRIC RANK
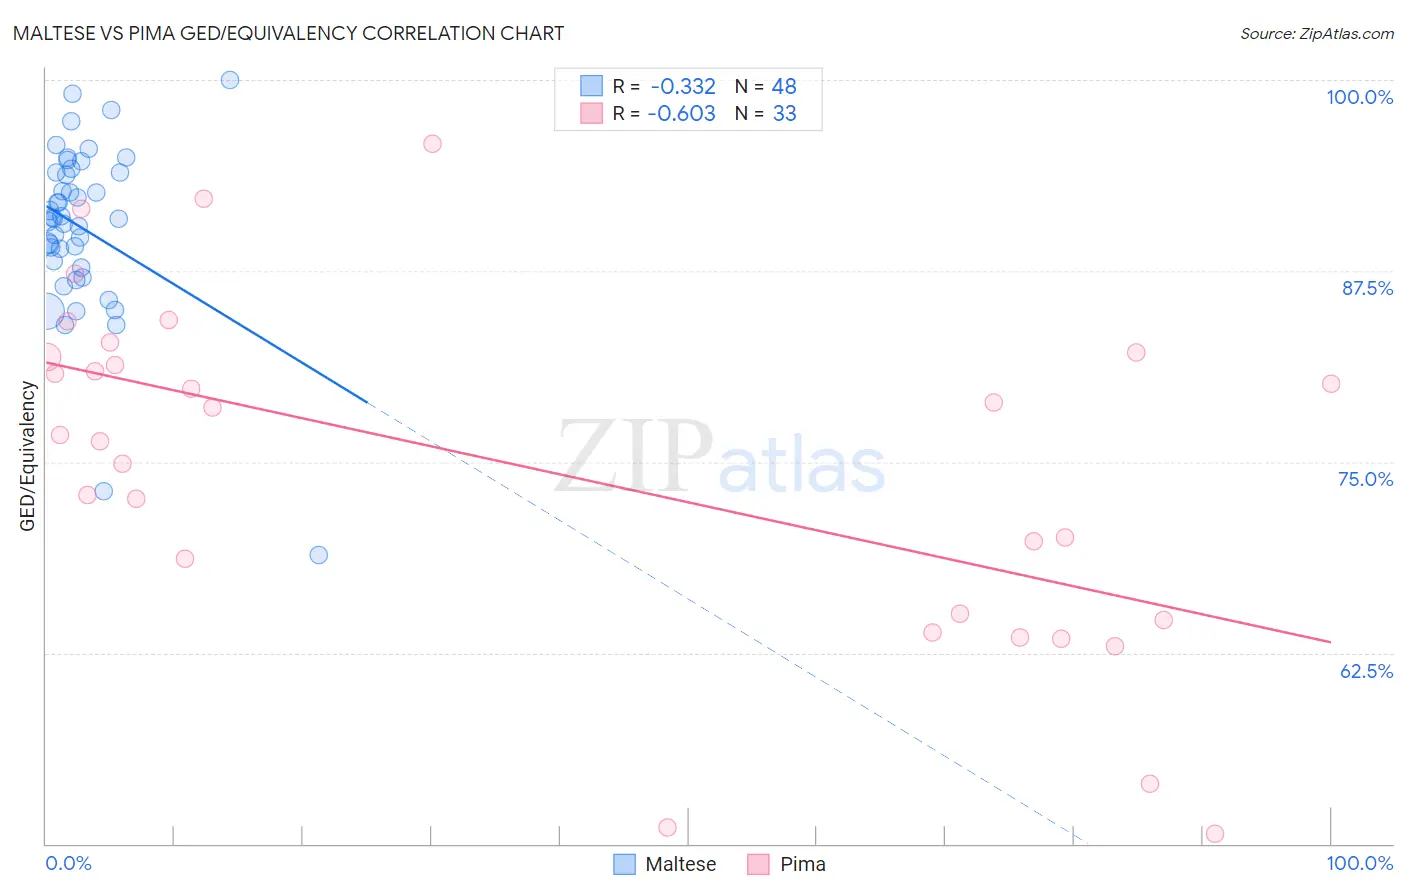
Maltese vs Pima GED/Equivalency Correlation Chart
The statistical analysis conducted on geographies consisting of 126,478,070 people shows a mild negative correlation between the proportion of Maltese and percentage of population with at least ged/equivalency education in the United States with a correlation coefficient (R) of -0.332 and weighted average of 88.6%. Similarly, the statistical analysis conducted on geographies consisting of 61,552,828 people shows a significant negative correlation between the proportion of Pima and percentage of population with at least ged/equivalency education in the United States with a correlation coefficient (R) of -0.603 and weighted average of 76.4%, a difference of 15.9%.
GED/Equivalency Correlation Summary
| Measurement | Maltese | Pima |
| Minimum | 68.9% | 50.7% |
| Maximum | 100.0% | 95.8% |
| Range | 31.1% | 45.2% |
| Mean | 90.3% | 74.7% |
| Median | 90.9% | 76.8% |
| Interquartile 25% (IQ1) | 87.9% | 64.8% |
| Interquartile 75% (IQ3) | 94.0% | 82.0% |
| Interquartile Range (IQR) | 6.0% | 17.2% |
| Standard Deviation (Sample) | 5.7% | 11.4% |
| Standard Deviation (Population) | 5.6% | 11.2% |
Similar Demographics by GED/Equivalency
Demographics Similar to Maltese by GED/Equivalency
In terms of ged/equivalency, the demographic groups most similar to Maltese are Luxembourger (88.6%, a difference of 0.010%), Immigrants from Ireland (88.6%, a difference of 0.020%), Russian (88.6%, a difference of 0.040%), Slovak (88.6%, a difference of 0.040%), and Estonian (88.6%, a difference of 0.040%).
| Demographics | Rating | Rank | GED/Equivalency |
| Immigrants | Iran | 99.9 /100 | #13 | Exceptional 88.9% |
| Cypriots | 99.9 /100 | #14 | Exceptional 88.9% |
| Okinawans | 99.9 /100 | #15 | Exceptional 88.9% |
| Immigrants | Taiwan | 99.9 /100 | #16 | Exceptional 88.8% |
| Croatians | 99.9 /100 | #17 | Exceptional 88.8% |
| Slovenes | 99.9 /100 | #18 | Exceptional 88.8% |
| Swedes | 99.9 /100 | #19 | Exceptional 88.8% |
| Maltese | 99.9 /100 | #20 | Exceptional 88.6% |
| Luxembourgers | 99.8 /100 | #21 | Exceptional 88.6% |
| Immigrants | Ireland | 99.8 /100 | #22 | Exceptional 88.6% |
| Russians | 99.8 /100 | #23 | Exceptional 88.6% |
| Slovaks | 99.8 /100 | #24 | Exceptional 88.6% |
| Estonians | 99.8 /100 | #25 | Exceptional 88.6% |
| Immigrants | Australia | 99.8 /100 | #26 | Exceptional 88.6% |
| Immigrants | Lithuania | 99.8 /100 | #27 | Exceptional 88.6% |
Demographics Similar to Pima by GED/Equivalency
In terms of ged/equivalency, the demographic groups most similar to Pima are Immigrants from Central America (76.4%, a difference of 0.090%), Spanish American Indian (76.3%, a difference of 0.12%), Immigrants from Mexico (75.7%, a difference of 1.0%), Mexican (77.4%, a difference of 1.3%), and Tohono O'odham (77.5%, a difference of 1.4%).
| Demographics | Rating | Rank | GED/Equivalency |
| Salvadorans | 0.0 /100 | #333 | Tragic 78.6% |
| Guatemalans | 0.0 /100 | #334 | Tragic 78.5% |
| Immigrants | Latin America | 0.0 /100 | #335 | Tragic 78.5% |
| Immigrants | Dominican Republic | 0.0 /100 | #336 | Tragic 78.0% |
| Immigrants | Yemen | 0.0 /100 | #337 | Tragic 77.9% |
| Immigrants | Guatemala | 0.0 /100 | #338 | Tragic 77.9% |
| Immigrants | El Salvador | 0.0 /100 | #339 | Tragic 77.6% |
| Tohono O'odham | 0.0 /100 | #340 | Tragic 77.5% |
| Mexicans | 0.0 /100 | #341 | Tragic 77.4% |
| Pima | 0.0 /100 | #342 | Tragic 76.4% |
| Immigrants | Central America | 0.0 /100 | #343 | Tragic 76.4% |
| Spanish American Indians | 0.0 /100 | #344 | Tragic 76.3% |
| Immigrants | Mexico | 0.0 /100 | #345 | Tragic 75.7% |
| Houma | 0.0 /100 | #346 | Tragic 75.0% |
| Yakama | 0.0 /100 | #347 | Tragic 74.5% |