Aleut vs Immigrants from Senegal Associate's Degree
COMPARE
Aleut
Immigrants from Senegal
Associate's Degree
Associate's Degree Comparison
Aleuts
Immigrants from Senegal
39.6%
ASSOCIATE'S DEGREE
0.0/ 100
METRIC RATING
287th/ 347
METRIC RANK
45.2%
ASSOCIATE'S DEGREE
21.2/ 100
METRIC RATING
199th/ 347
METRIC RANK
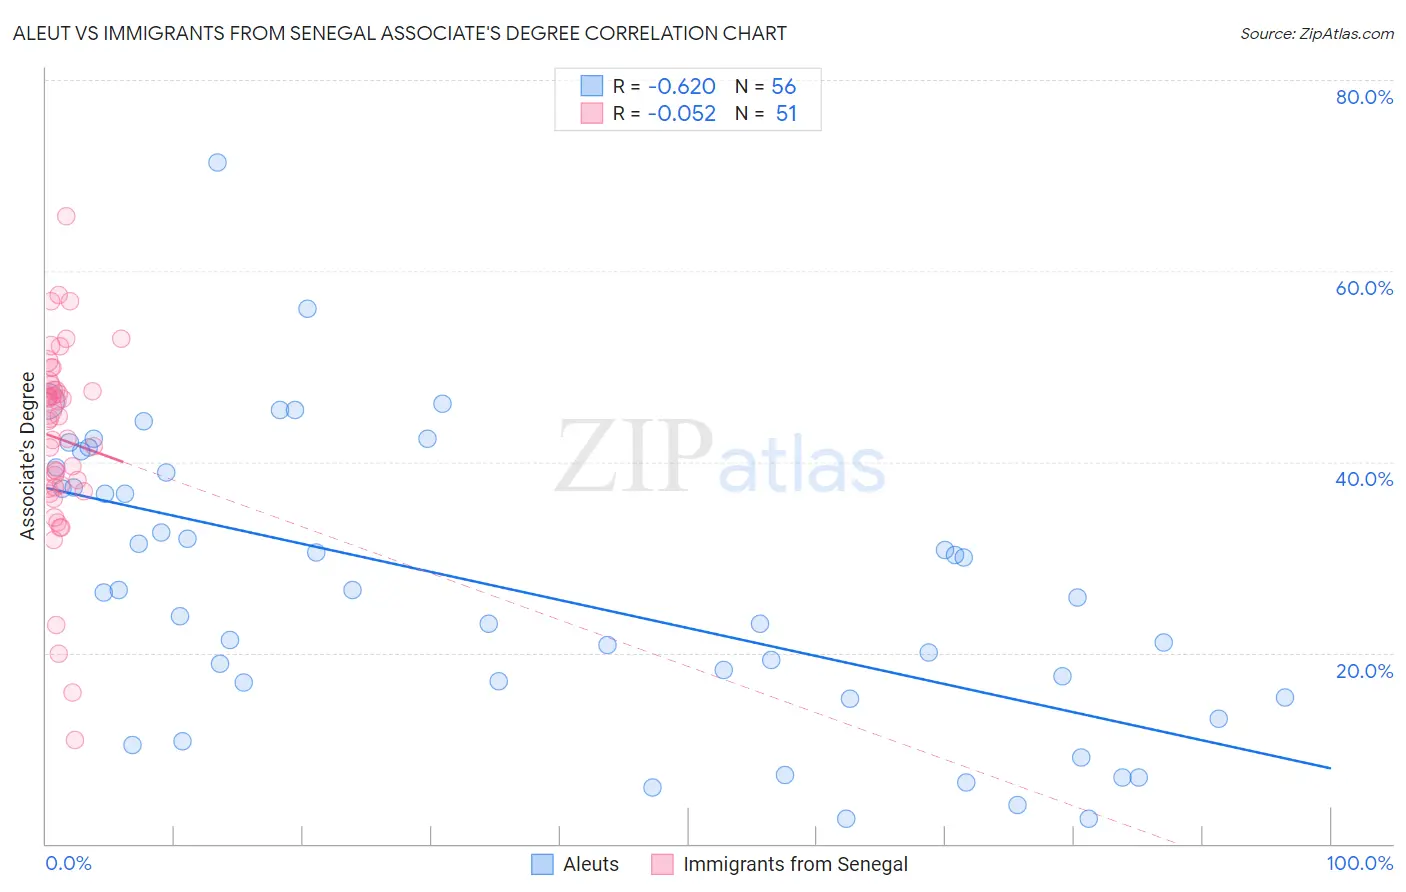
Aleut vs Immigrants from Senegal Associate's Degree Correlation Chart
The statistical analysis conducted on geographies consisting of 61,782,803 people shows a significant negative correlation between the proportion of Aleuts and percentage of population with at least associate's degree education in the United States with a correlation coefficient (R) of -0.620 and weighted average of 39.6%. Similarly, the statistical analysis conducted on geographies consisting of 90,125,204 people shows a slight negative correlation between the proportion of Immigrants from Senegal and percentage of population with at least associate's degree education in the United States with a correlation coefficient (R) of -0.052 and weighted average of 45.2%, a difference of 14.1%.
Associate's Degree Correlation Summary
| Measurement | Aleut | Immigrants from Senegal |
| Minimum | 2.6% | 10.9% |
| Maximum | 71.3% | 65.7% |
| Range | 68.7% | 54.8% |
| Mean | 26.6% | 42.4% |
| Median | 26.0% | 44.5% |
| Interquartile 25% (IQ1) | 16.1% | 37.2% |
| Interquartile 75% (IQ3) | 38.1% | 48.1% |
| Interquartile Range (IQR) | 22.0% | 10.9% |
| Standard Deviation (Sample) | 14.9% | 10.3% |
| Standard Deviation (Population) | 14.8% | 10.2% |
Similar Demographics by Associate's Degree
Demographics Similar to Aleuts by Associate's Degree
In terms of associate's degree, the demographic groups most similar to Aleuts are Immigrants from Cuba (39.5%, a difference of 0.24%), Immigrants from Caribbean (39.7%, a difference of 0.26%), Central American (39.4%, a difference of 0.50%), Immigrants from Belize (39.9%, a difference of 0.60%), and Comanche (39.9%, a difference of 0.70%).
| Demographics | Rating | Rank | Associate's Degree |
| Immigrants | Micronesia | 0.1 /100 | #280 | Tragic 40.2% |
| Immigrants | Portugal | 0.1 /100 | #281 | Tragic 40.1% |
| Bangladeshis | 0.1 /100 | #282 | Tragic 40.0% |
| Haitians | 0.1 /100 | #283 | Tragic 40.0% |
| Comanche | 0.1 /100 | #284 | Tragic 39.9% |
| Immigrants | Belize | 0.1 /100 | #285 | Tragic 39.9% |
| Immigrants | Caribbean | 0.0 /100 | #286 | Tragic 39.7% |
| Aleuts | 0.0 /100 | #287 | Tragic 39.6% |
| Immigrants | Cuba | 0.0 /100 | #288 | Tragic 39.5% |
| Central Americans | 0.0 /100 | #289 | Tragic 39.4% |
| Immigrants | Haiti | 0.0 /100 | #290 | Tragic 39.3% |
| Dominicans | 0.0 /100 | #291 | Tragic 39.3% |
| Blacks/African Americans | 0.0 /100 | #292 | Tragic 39.1% |
| Nepalese | 0.0 /100 | #293 | Tragic 39.0% |
| Salvadorans | 0.0 /100 | #294 | Tragic 39.0% |
Demographics Similar to Immigrants from Senegal by Associate's Degree
In terms of associate's degree, the demographic groups most similar to Immigrants from Senegal are Senegalese (45.2%, a difference of 0.010%), Immigrants from Bangladesh (45.2%, a difference of 0.020%), Immigrants from Vietnam (45.2%, a difference of 0.040%), Spaniard (45.2%, a difference of 0.090%), and Immigrants from South Eastern Asia (45.2%, a difference of 0.11%).
| Demographics | Rating | Rank | Associate's Degree |
| Celtics | 33.3 /100 | #192 | Fair 45.8% |
| Immigrants | Cameroon | 31.0 /100 | #193 | Fair 45.7% |
| Immigrants | Peru | 27.6 /100 | #194 | Fair 45.5% |
| Germans | 26.5 /100 | #195 | Fair 45.5% |
| French | 25.6 /100 | #196 | Fair 45.4% |
| Scotch-Irish | 22.3 /100 | #197 | Fair 45.3% |
| Immigrants | Bangladesh | 21.3 /100 | #198 | Fair 45.2% |
| Immigrants | Senegal | 21.2 /100 | #199 | Fair 45.2% |
| Senegalese | 21.1 /100 | #200 | Fair 45.2% |
| Immigrants | Vietnam | 20.8 /100 | #201 | Fair 45.2% |
| Spaniards | 20.4 /100 | #202 | Fair 45.2% |
| Immigrants | South Eastern Asia | 20.2 /100 | #203 | Fair 45.2% |
| Nigerians | 19.1 /100 | #204 | Poor 45.1% |
| Immigrants | Thailand | 18.9 /100 | #205 | Poor 45.1% |
| German Russians | 18.9 /100 | #206 | Poor 45.1% |