Aleut vs Immigrants from Haiti Associate's Degree
COMPARE
Aleut
Immigrants from Haiti
Associate's Degree
Associate's Degree Comparison
Aleuts
Immigrants from Haiti
39.6%
ASSOCIATE'S DEGREE
0.0/ 100
METRIC RATING
287th/ 347
METRIC RANK
39.3%
ASSOCIATE'S DEGREE
0.0/ 100
METRIC RATING
290th/ 347
METRIC RANK
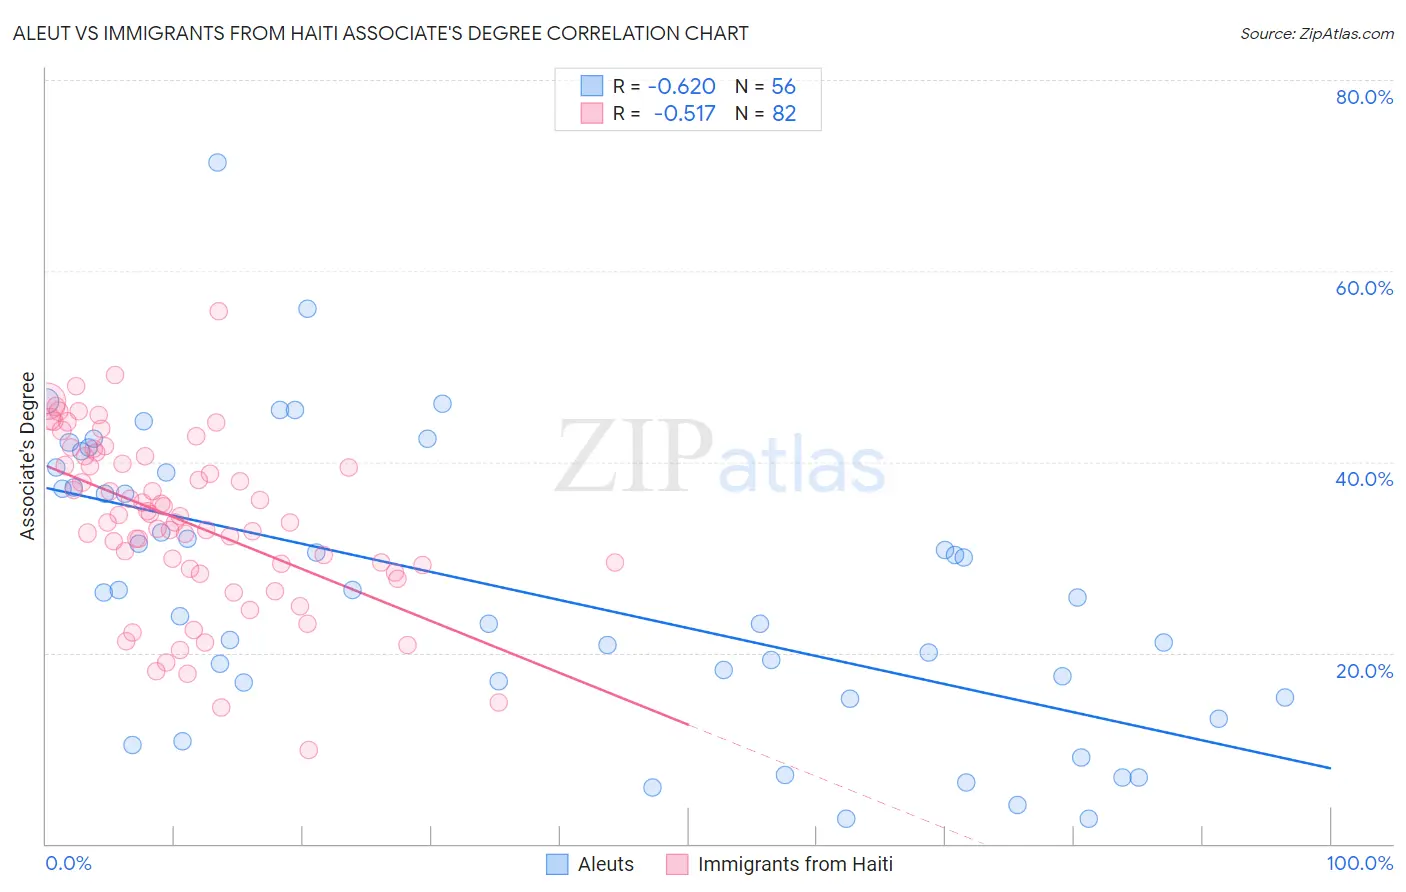
Aleut vs Immigrants from Haiti Associate's Degree Correlation Chart
The statistical analysis conducted on geographies consisting of 61,782,803 people shows a significant negative correlation between the proportion of Aleuts and percentage of population with at least associate's degree education in the United States with a correlation coefficient (R) of -0.620 and weighted average of 39.6%. Similarly, the statistical analysis conducted on geographies consisting of 225,274,856 people shows a substantial negative correlation between the proportion of Immigrants from Haiti and percentage of population with at least associate's degree education in the United States with a correlation coefficient (R) of -0.517 and weighted average of 39.3%, a difference of 0.95%.
Associate's Degree Correlation Summary
| Measurement | Aleut | Immigrants from Haiti |
| Minimum | 2.6% | 9.8% |
| Maximum | 71.3% | 55.8% |
| Range | 68.7% | 46.0% |
| Mean | 26.6% | 33.7% |
| Median | 26.0% | 34.0% |
| Interquartile 25% (IQ1) | 16.1% | 28.8% |
| Interquartile 75% (IQ3) | 38.1% | 40.6% |
| Interquartile Range (IQR) | 22.0% | 11.7% |
| Standard Deviation (Sample) | 14.9% | 9.0% |
| Standard Deviation (Population) | 14.8% | 8.9% |
Demographics Similar to Aleuts and Immigrants from Haiti by Associate's Degree
In terms of associate's degree, the demographic groups most similar to Aleuts are Immigrants from Cuba (39.5%, a difference of 0.24%), Immigrants from Caribbean (39.7%, a difference of 0.26%), Central American (39.4%, a difference of 0.50%), Immigrants from Belize (39.9%, a difference of 0.60%), and Comanche (39.9%, a difference of 0.70%). Similarly, the demographic groups most similar to Immigrants from Haiti are Dominican (39.3%, a difference of 0.010%), Black/African American (39.1%, a difference of 0.30%), Central American (39.4%, a difference of 0.44%), Nepalese (39.0%, a difference of 0.55%), and Salvadoran (39.0%, a difference of 0.55%).
| Demographics | Rating | Rank | Associate's Degree |
| Ottawa | 0.1 /100 | #278 | Tragic 40.3% |
| Immigrants | Nicaragua | 0.1 /100 | #279 | Tragic 40.3% |
| Immigrants | Micronesia | 0.1 /100 | #280 | Tragic 40.2% |
| Immigrants | Portugal | 0.1 /100 | #281 | Tragic 40.1% |
| Bangladeshis | 0.1 /100 | #282 | Tragic 40.0% |
| Haitians | 0.1 /100 | #283 | Tragic 40.0% |
| Comanche | 0.1 /100 | #284 | Tragic 39.9% |
| Immigrants | Belize | 0.1 /100 | #285 | Tragic 39.9% |
| Immigrants | Caribbean | 0.0 /100 | #286 | Tragic 39.7% |
| Aleuts | 0.0 /100 | #287 | Tragic 39.6% |
| Immigrants | Cuba | 0.0 /100 | #288 | Tragic 39.5% |
| Central Americans | 0.0 /100 | #289 | Tragic 39.4% |
| Immigrants | Haiti | 0.0 /100 | #290 | Tragic 39.3% |
| Dominicans | 0.0 /100 | #291 | Tragic 39.3% |
| Blacks/African Americans | 0.0 /100 | #292 | Tragic 39.1% |
| Nepalese | 0.0 /100 | #293 | Tragic 39.0% |
| Salvadorans | 0.0 /100 | #294 | Tragic 39.0% |
| Hondurans | 0.0 /100 | #295 | Tragic 38.9% |
| Cherokee | 0.0 /100 | #296 | Tragic 38.9% |
| Cape Verdeans | 0.0 /100 | #297 | Tragic 38.8% |
| Cheyenne | 0.0 /100 | #298 | Tragic 38.7% |