Chippewa vs Immigrants from Senegal Associate's Degree
COMPARE
Chippewa
Immigrants from Senegal
Associate's Degree
Associate's Degree Comparison
Chippewa
Immigrants from Senegal
40.7%
ASSOCIATE'S DEGREE
0.2/ 100
METRIC RATING
270th/ 347
METRIC RANK
45.2%
ASSOCIATE'S DEGREE
21.2/ 100
METRIC RATING
199th/ 347
METRIC RANK
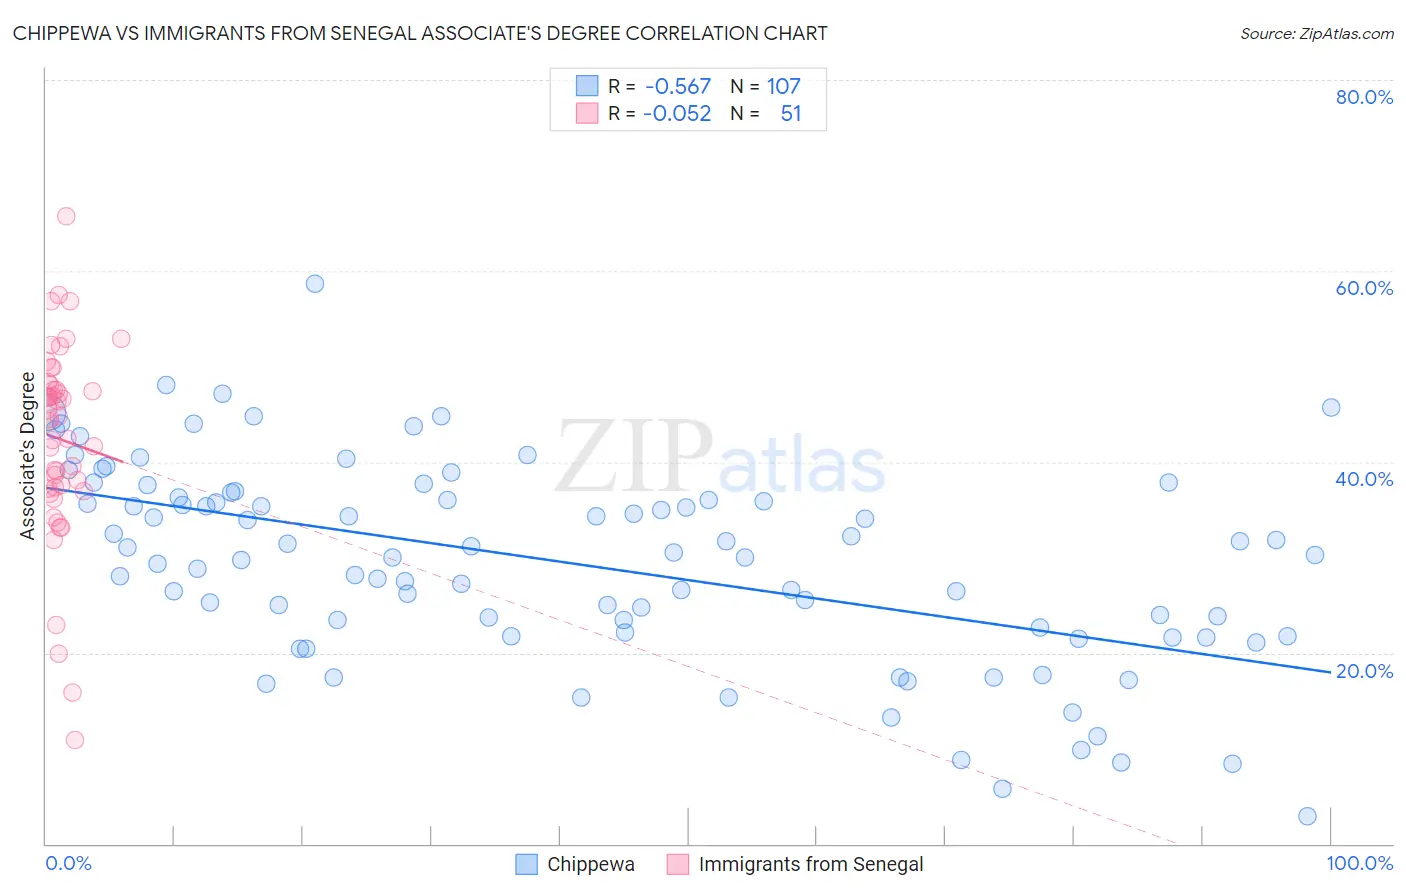
Chippewa vs Immigrants from Senegal Associate's Degree Correlation Chart
The statistical analysis conducted on geographies consisting of 215,061,498 people shows a substantial negative correlation between the proportion of Chippewa and percentage of population with at least associate's degree education in the United States with a correlation coefficient (R) of -0.567 and weighted average of 40.7%. Similarly, the statistical analysis conducted on geographies consisting of 90,125,204 people shows a slight negative correlation between the proportion of Immigrants from Senegal and percentage of population with at least associate's degree education in the United States with a correlation coefficient (R) of -0.052 and weighted average of 45.2%, a difference of 11.0%.
Associate's Degree Correlation Summary
| Measurement | Chippewa | Immigrants from Senegal |
| Minimum | 2.9% | 10.9% |
| Maximum | 58.7% | 65.7% |
| Range | 55.8% | 54.8% |
| Mean | 29.5% | 42.4% |
| Median | 30.2% | 44.5% |
| Interquartile 25% (IQ1) | 22.1% | 37.2% |
| Interquartile 75% (IQ3) | 36.2% | 48.1% |
| Interquartile Range (IQR) | 14.1% | 10.9% |
| Standard Deviation (Sample) | 10.5% | 10.3% |
| Standard Deviation (Population) | 10.4% | 10.2% |
Similar Demographics by Associate's Degree
Demographics Similar to Chippewa by Associate's Degree
In terms of associate's degree, the demographic groups most similar to Chippewa are American (40.8%, a difference of 0.050%), Immigrants from Laos (40.7%, a difference of 0.18%), Central American Indian (40.8%, a difference of 0.23%), Belizean (40.6%, a difference of 0.25%), and Hawaiian (40.9%, a difference of 0.42%).
| Demographics | Rating | Rank | Associate's Degree |
| Immigrants | Jamaica | 0.3 /100 | #263 | Tragic 41.5% |
| Osage | 0.3 /100 | #264 | Tragic 41.5% |
| Africans | 0.2 /100 | #265 | Tragic 41.1% |
| Samoans | 0.2 /100 | #266 | Tragic 41.1% |
| Hawaiians | 0.2 /100 | #267 | Tragic 40.9% |
| Central American Indians | 0.2 /100 | #268 | Tragic 40.8% |
| Americans | 0.2 /100 | #269 | Tragic 40.8% |
| Chippewa | 0.2 /100 | #270 | Tragic 40.7% |
| Immigrants | Laos | 0.1 /100 | #271 | Tragic 40.7% |
| Belizeans | 0.1 /100 | #272 | Tragic 40.6% |
| Puget Sound Salish | 0.1 /100 | #273 | Tragic 40.5% |
| Immigrants | Dominica | 0.1 /100 | #274 | Tragic 40.5% |
| Potawatomi | 0.1 /100 | #275 | Tragic 40.4% |
| Puerto Ricans | 0.1 /100 | #276 | Tragic 40.4% |
| Blackfeet | 0.1 /100 | #277 | Tragic 40.3% |
Demographics Similar to Immigrants from Senegal by Associate's Degree
In terms of associate's degree, the demographic groups most similar to Immigrants from Senegal are Senegalese (45.2%, a difference of 0.010%), Immigrants from Bangladesh (45.2%, a difference of 0.020%), Immigrants from Vietnam (45.2%, a difference of 0.040%), Spaniard (45.2%, a difference of 0.090%), and Immigrants from South Eastern Asia (45.2%, a difference of 0.11%).
| Demographics | Rating | Rank | Associate's Degree |
| Celtics | 33.3 /100 | #192 | Fair 45.8% |
| Immigrants | Cameroon | 31.0 /100 | #193 | Fair 45.7% |
| Immigrants | Peru | 27.6 /100 | #194 | Fair 45.5% |
| Germans | 26.5 /100 | #195 | Fair 45.5% |
| French | 25.6 /100 | #196 | Fair 45.4% |
| Scotch-Irish | 22.3 /100 | #197 | Fair 45.3% |
| Immigrants | Bangladesh | 21.3 /100 | #198 | Fair 45.2% |
| Immigrants | Senegal | 21.2 /100 | #199 | Fair 45.2% |
| Senegalese | 21.1 /100 | #200 | Fair 45.2% |
| Immigrants | Vietnam | 20.8 /100 | #201 | Fair 45.2% |
| Spaniards | 20.4 /100 | #202 | Fair 45.2% |
| Immigrants | South Eastern Asia | 20.2 /100 | #203 | Fair 45.2% |
| Nigerians | 19.1 /100 | #204 | Poor 45.1% |
| Immigrants | Thailand | 18.9 /100 | #205 | Poor 45.1% |
| German Russians | 18.9 /100 | #206 | Poor 45.1% |