Aleut vs Immigrants from Cameroon Associate's Degree
COMPARE
Aleut
Immigrants from Cameroon
Associate's Degree
Associate's Degree Comparison
Aleuts
Immigrants from Cameroon
39.6%
ASSOCIATE'S DEGREE
0.0/ 100
METRIC RATING
287th/ 347
METRIC RANK
45.7%
ASSOCIATE'S DEGREE
31.0/ 100
METRIC RATING
193rd/ 347
METRIC RANK
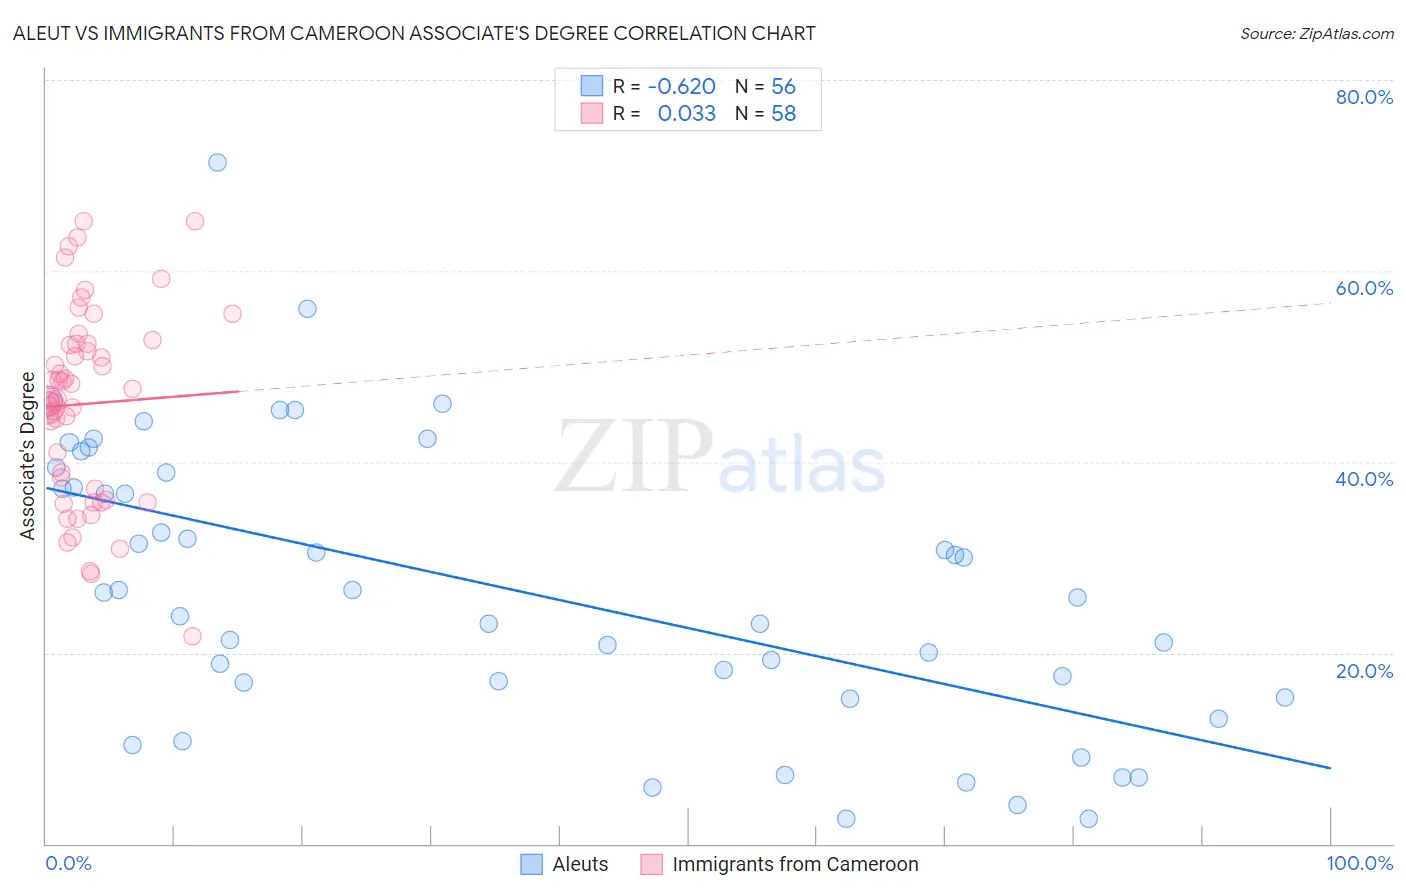
Aleut vs Immigrants from Cameroon Associate's Degree Correlation Chart
The statistical analysis conducted on geographies consisting of 61,782,803 people shows a significant negative correlation between the proportion of Aleuts and percentage of population with at least associate's degree education in the United States with a correlation coefficient (R) of -0.620 and weighted average of 39.6%. Similarly, the statistical analysis conducted on geographies consisting of 130,766,713 people shows no correlation between the proportion of Immigrants from Cameroon and percentage of population with at least associate's degree education in the United States with a correlation coefficient (R) of 0.033 and weighted average of 45.7%, a difference of 15.2%.
Associate's Degree Correlation Summary
| Measurement | Aleut | Immigrants from Cameroon |
| Minimum | 2.6% | 21.7% |
| Maximum | 71.3% | 65.2% |
| Range | 68.7% | 43.4% |
| Mean | 26.6% | 46.1% |
| Median | 26.0% | 46.5% |
| Interquartile 25% (IQ1) | 16.1% | 37.1% |
| Interquartile 75% (IQ3) | 38.1% | 52.3% |
| Interquartile Range (IQR) | 22.0% | 15.2% |
| Standard Deviation (Sample) | 14.9% | 10.0% |
| Standard Deviation (Population) | 14.8% | 9.9% |
Similar Demographics by Associate's Degree
Demographics Similar to Aleuts by Associate's Degree
In terms of associate's degree, the demographic groups most similar to Aleuts are Immigrants from Cuba (39.5%, a difference of 0.24%), Immigrants from Caribbean (39.7%, a difference of 0.26%), Central American (39.4%, a difference of 0.50%), Immigrants from Belize (39.9%, a difference of 0.60%), and Comanche (39.9%, a difference of 0.70%).
| Demographics | Rating | Rank | Associate's Degree |
| Immigrants | Micronesia | 0.1 /100 | #280 | Tragic 40.2% |
| Immigrants | Portugal | 0.1 /100 | #281 | Tragic 40.1% |
| Bangladeshis | 0.1 /100 | #282 | Tragic 40.0% |
| Haitians | 0.1 /100 | #283 | Tragic 40.0% |
| Comanche | 0.1 /100 | #284 | Tragic 39.9% |
| Immigrants | Belize | 0.1 /100 | #285 | Tragic 39.9% |
| Immigrants | Caribbean | 0.0 /100 | #286 | Tragic 39.7% |
| Aleuts | 0.0 /100 | #287 | Tragic 39.6% |
| Immigrants | Cuba | 0.0 /100 | #288 | Tragic 39.5% |
| Central Americans | 0.0 /100 | #289 | Tragic 39.4% |
| Immigrants | Haiti | 0.0 /100 | #290 | Tragic 39.3% |
| Dominicans | 0.0 /100 | #291 | Tragic 39.3% |
| Blacks/African Americans | 0.0 /100 | #292 | Tragic 39.1% |
| Nepalese | 0.0 /100 | #293 | Tragic 39.0% |
| Salvadorans | 0.0 /100 | #294 | Tragic 39.0% |
Demographics Similar to Immigrants from Cameroon by Associate's Degree
In terms of associate's degree, the demographic groups most similar to Immigrants from Cameroon are Celtic (45.8%, a difference of 0.20%), Korean (45.8%, a difference of 0.24%), Vietnamese (45.8%, a difference of 0.26%), Immigrants from Oceania (45.8%, a difference of 0.32%), and Immigrants from Peru (45.5%, a difference of 0.32%).
| Demographics | Rating | Rank | Associate's Degree |
| Welsh | 37.9 /100 | #186 | Fair 45.9% |
| Immigrants | Uruguay | 35.5 /100 | #187 | Fair 45.8% |
| Ghanaians | 35.5 /100 | #188 | Fair 45.8% |
| Immigrants | Oceania | 34.7 /100 | #189 | Fair 45.8% |
| Vietnamese | 34.0 /100 | #190 | Fair 45.8% |
| Koreans | 33.8 /100 | #191 | Fair 45.8% |
| Celtics | 33.3 /100 | #192 | Fair 45.8% |
| Immigrants | Cameroon | 31.0 /100 | #193 | Fair 45.7% |
| Immigrants | Peru | 27.6 /100 | #194 | Fair 45.5% |
| Germans | 26.5 /100 | #195 | Fair 45.5% |
| French | 25.6 /100 | #196 | Fair 45.4% |
| Scotch-Irish | 22.3 /100 | #197 | Fair 45.3% |
| Immigrants | Bangladesh | 21.3 /100 | #198 | Fair 45.2% |
| Immigrants | Senegal | 21.2 /100 | #199 | Fair 45.2% |
| Senegalese | 21.1 /100 | #200 | Fair 45.2% |