Aleut vs Immigrants from Russia Associate's Degree
COMPARE
Aleut
Immigrants from Russia
Associate's Degree
Associate's Degree Comparison
Aleuts
Immigrants from Russia
39.6%
ASSOCIATE'S DEGREE
0.0/ 100
METRIC RATING
287th/ 347
METRIC RANK
53.1%
ASSOCIATE'S DEGREE
100.0/ 100
METRIC RATING
36th/ 347
METRIC RANK
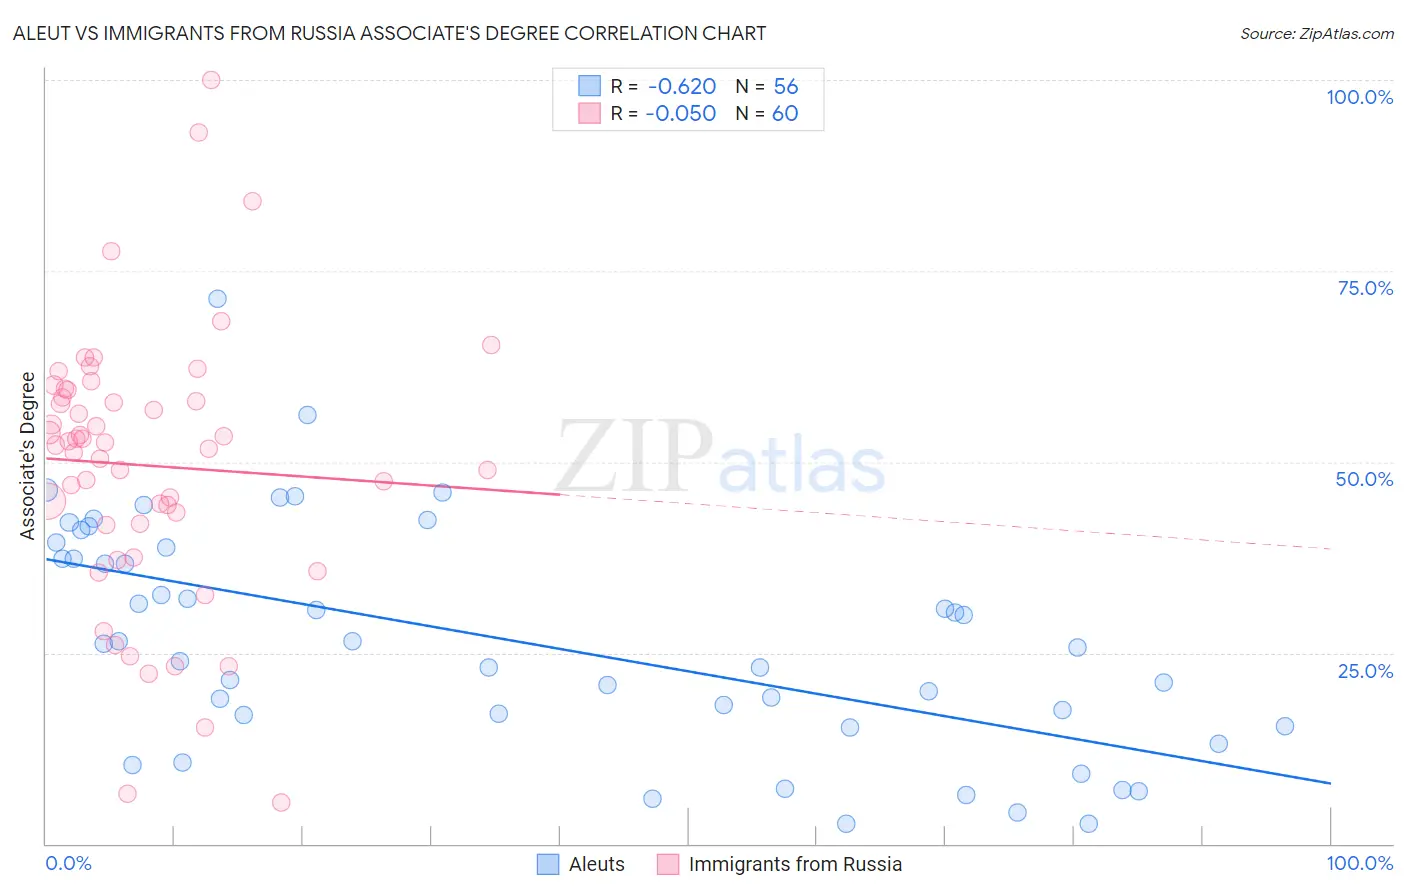
Aleut vs Immigrants from Russia Associate's Degree Correlation Chart
The statistical analysis conducted on geographies consisting of 61,782,803 people shows a significant negative correlation between the proportion of Aleuts and percentage of population with at least associate's degree education in the United States with a correlation coefficient (R) of -0.620 and weighted average of 39.6%. Similarly, the statistical analysis conducted on geographies consisting of 347,909,323 people shows no correlation between the proportion of Immigrants from Russia and percentage of population with at least associate's degree education in the United States with a correlation coefficient (R) of -0.050 and weighted average of 53.1%, a difference of 34.0%.
Associate's Degree Correlation Summary
| Measurement | Aleut | Immigrants from Russia |
| Minimum | 2.6% | 5.4% |
| Maximum | 71.3% | 100.0% |
| Range | 68.7% | 94.6% |
| Mean | 26.6% | 49.5% |
| Median | 26.0% | 52.4% |
| Interquartile 25% (IQ1) | 16.1% | 41.8% |
| Interquartile 75% (IQ3) | 38.1% | 59.0% |
| Interquartile Range (IQR) | 22.0% | 17.1% |
| Standard Deviation (Sample) | 14.9% | 17.9% |
| Standard Deviation (Population) | 14.8% | 17.7% |
Similar Demographics by Associate's Degree
Demographics Similar to Aleuts by Associate's Degree
In terms of associate's degree, the demographic groups most similar to Aleuts are Immigrants from Cuba (39.5%, a difference of 0.24%), Immigrants from Caribbean (39.7%, a difference of 0.26%), Central American (39.4%, a difference of 0.50%), Immigrants from Belize (39.9%, a difference of 0.60%), and Comanche (39.9%, a difference of 0.70%).
| Demographics | Rating | Rank | Associate's Degree |
| Immigrants | Micronesia | 0.1 /100 | #280 | Tragic 40.2% |
| Immigrants | Portugal | 0.1 /100 | #281 | Tragic 40.1% |
| Bangladeshis | 0.1 /100 | #282 | Tragic 40.0% |
| Haitians | 0.1 /100 | #283 | Tragic 40.0% |
| Comanche | 0.1 /100 | #284 | Tragic 39.9% |
| Immigrants | Belize | 0.1 /100 | #285 | Tragic 39.9% |
| Immigrants | Caribbean | 0.0 /100 | #286 | Tragic 39.7% |
| Aleuts | 0.0 /100 | #287 | Tragic 39.6% |
| Immigrants | Cuba | 0.0 /100 | #288 | Tragic 39.5% |
| Central Americans | 0.0 /100 | #289 | Tragic 39.4% |
| Immigrants | Haiti | 0.0 /100 | #290 | Tragic 39.3% |
| Dominicans | 0.0 /100 | #291 | Tragic 39.3% |
| Blacks/African Americans | 0.0 /100 | #292 | Tragic 39.1% |
| Nepalese | 0.0 /100 | #293 | Tragic 39.0% |
| Salvadorans | 0.0 /100 | #294 | Tragic 39.0% |
Demographics Similar to Immigrants from Russia by Associate's Degree
In terms of associate's degree, the demographic groups most similar to Immigrants from Russia are Immigrants from Denmark (53.1%, a difference of 0.080%), Mongolian (53.0%, a difference of 0.25%), Russian (53.2%, a difference of 0.28%), Bulgarian (53.3%, a difference of 0.35%), and Immigrants from Belarus (52.8%, a difference of 0.53%).
| Demographics | Rating | Rank | Associate's Degree |
| Immigrants | France | 100.0 /100 | #29 | Exceptional 53.9% |
| Immigrants | Sri Lanka | 100.0 /100 | #30 | Exceptional 53.7% |
| Immigrants | Northern Europe | 100.0 /100 | #31 | Exceptional 53.5% |
| Immigrants | Turkey | 100.0 /100 | #32 | Exceptional 53.4% |
| Israelis | 100.0 /100 | #33 | Exceptional 53.4% |
| Bulgarians | 100.0 /100 | #34 | Exceptional 53.3% |
| Russians | 100.0 /100 | #35 | Exceptional 53.2% |
| Immigrants | Russia | 100.0 /100 | #36 | Exceptional 53.1% |
| Immigrants | Denmark | 100.0 /100 | #37 | Exceptional 53.1% |
| Mongolians | 100.0 /100 | #38 | Exceptional 53.0% |
| Immigrants | Belarus | 99.9 /100 | #39 | Exceptional 52.8% |
| Immigrants | Latvia | 99.9 /100 | #40 | Exceptional 52.8% |
| Immigrants | Saudi Arabia | 99.9 /100 | #41 | Exceptional 52.6% |
| Immigrants | Malaysia | 99.9 /100 | #42 | Exceptional 52.5% |
| Immigrants | South Africa | 99.9 /100 | #43 | Exceptional 52.5% |