Maltese vs Immigrants from Senegal Associate's Degree
COMPARE
Maltese
Immigrants from Senegal
Associate's Degree
Associate's Degree Comparison
Maltese
Immigrants from Senegal
50.4%
ASSOCIATE'S DEGREE
99.1/ 100
METRIC RATING
81st/ 347
METRIC RANK
45.2%
ASSOCIATE'S DEGREE
21.2/ 100
METRIC RATING
199th/ 347
METRIC RANK
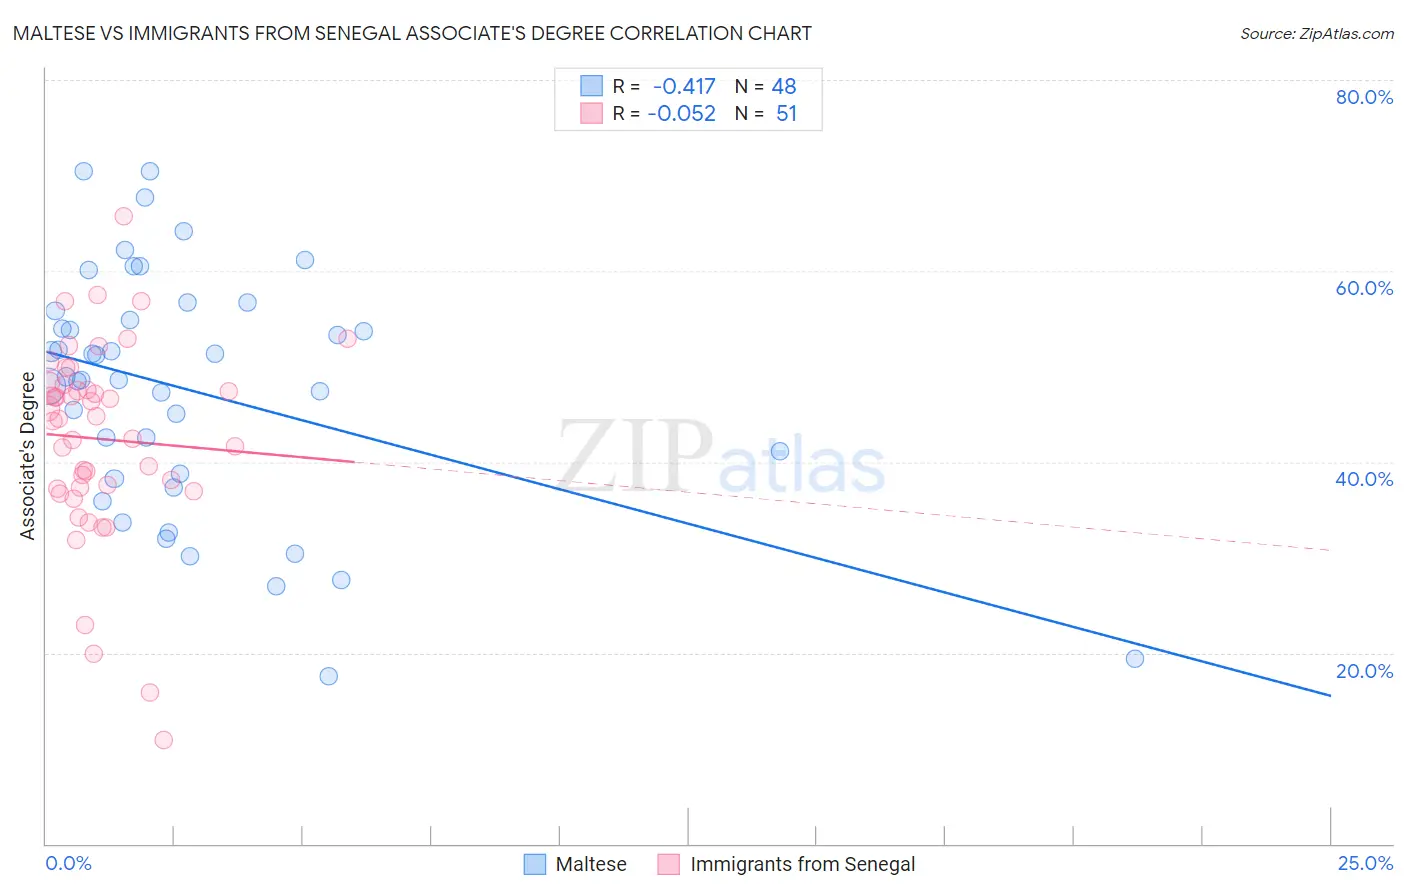
Maltese vs Immigrants from Senegal Associate's Degree Correlation Chart
The statistical analysis conducted on geographies consisting of 126,471,941 people shows a moderate negative correlation between the proportion of Maltese and percentage of population with at least associate's degree education in the United States with a correlation coefficient (R) of -0.417 and weighted average of 50.4%. Similarly, the statistical analysis conducted on geographies consisting of 90,125,204 people shows a slight negative correlation between the proportion of Immigrants from Senegal and percentage of population with at least associate's degree education in the United States with a correlation coefficient (R) of -0.052 and weighted average of 45.2%, a difference of 11.5%.
Associate's Degree Correlation Summary
| Measurement | Maltese | Immigrants from Senegal |
| Minimum | 17.6% | 10.9% |
| Maximum | 70.5% | 65.7% |
| Range | 52.9% | 54.8% |
| Mean | 47.5% | 42.4% |
| Median | 48.7% | 44.5% |
| Interquartile 25% (IQ1) | 38.5% | 37.2% |
| Interquartile 75% (IQ3) | 55.3% | 48.1% |
| Interquartile Range (IQR) | 16.8% | 10.9% |
| Standard Deviation (Sample) | 12.6% | 10.3% |
| Standard Deviation (Population) | 12.5% | 10.2% |
Similar Demographics by Associate's Degree
Demographics Similar to Maltese by Associate's Degree
In terms of associate's degree, the demographic groups most similar to Maltese are Armenian (50.4%, a difference of 0.070%), Ethiopian (50.4%, a difference of 0.10%), Immigrants from Eastern Europe (50.5%, a difference of 0.12%), Immigrants from Lebanon (50.5%, a difference of 0.16%), and Immigrants from Zimbabwe (50.5%, a difference of 0.19%).
| Demographics | Rating | Rank | Associate's Degree |
| Lithuanians | 99.3 /100 | #74 | Exceptional 50.6% |
| Immigrants | Scotland | 99.3 /100 | #75 | Exceptional 50.6% |
| Immigrants | Zimbabwe | 99.2 /100 | #76 | Exceptional 50.5% |
| Immigrants | Lebanon | 99.1 /100 | #77 | Exceptional 50.5% |
| Immigrants | Eastern Europe | 99.1 /100 | #78 | Exceptional 50.5% |
| Ethiopians | 99.1 /100 | #79 | Exceptional 50.4% |
| Armenians | 99.1 /100 | #80 | Exceptional 50.4% |
| Maltese | 99.1 /100 | #81 | Exceptional 50.4% |
| Greeks | 98.9 /100 | #82 | Exceptional 50.3% |
| Immigrants | Uzbekistan | 98.9 /100 | #83 | Exceptional 50.3% |
| Immigrants | Hungary | 98.9 /100 | #84 | Exceptional 50.2% |
| Immigrants | Egypt | 98.9 /100 | #85 | Exceptional 50.2% |
| Immigrants | Croatia | 98.9 /100 | #86 | Exceptional 50.2% |
| Immigrants | Moldova | 98.8 /100 | #87 | Exceptional 50.2% |
| Immigrants | Canada | 98.7 /100 | #88 | Exceptional 50.1% |
Demographics Similar to Immigrants from Senegal by Associate's Degree
In terms of associate's degree, the demographic groups most similar to Immigrants from Senegal are Senegalese (45.2%, a difference of 0.010%), Immigrants from Bangladesh (45.2%, a difference of 0.020%), Immigrants from Vietnam (45.2%, a difference of 0.040%), Spaniard (45.2%, a difference of 0.090%), and Immigrants from South Eastern Asia (45.2%, a difference of 0.11%).
| Demographics | Rating | Rank | Associate's Degree |
| Celtics | 33.3 /100 | #192 | Fair 45.8% |
| Immigrants | Cameroon | 31.0 /100 | #193 | Fair 45.7% |
| Immigrants | Peru | 27.6 /100 | #194 | Fair 45.5% |
| Germans | 26.5 /100 | #195 | Fair 45.5% |
| French | 25.6 /100 | #196 | Fair 45.4% |
| Scotch-Irish | 22.3 /100 | #197 | Fair 45.3% |
| Immigrants | Bangladesh | 21.3 /100 | #198 | Fair 45.2% |
| Immigrants | Senegal | 21.2 /100 | #199 | Fair 45.2% |
| Senegalese | 21.1 /100 | #200 | Fair 45.2% |
| Immigrants | Vietnam | 20.8 /100 | #201 | Fair 45.2% |
| Spaniards | 20.4 /100 | #202 | Fair 45.2% |
| Immigrants | South Eastern Asia | 20.2 /100 | #203 | Fair 45.2% |
| Nigerians | 19.1 /100 | #204 | Poor 45.1% |
| Immigrants | Thailand | 18.9 /100 | #205 | Poor 45.1% |
| German Russians | 18.9 /100 | #206 | Poor 45.1% |