Australian vs Immigrants from Senegal Associate's Degree
COMPARE
Australian
Immigrants from Senegal
Associate's Degree
Associate's Degree Comparison
Australians
Immigrants from Senegal
51.9%
ASSOCIATE'S DEGREE
99.8/ 100
METRIC RATING
55th/ 347
METRIC RANK
45.2%
ASSOCIATE'S DEGREE
21.2/ 100
METRIC RATING
199th/ 347
METRIC RANK
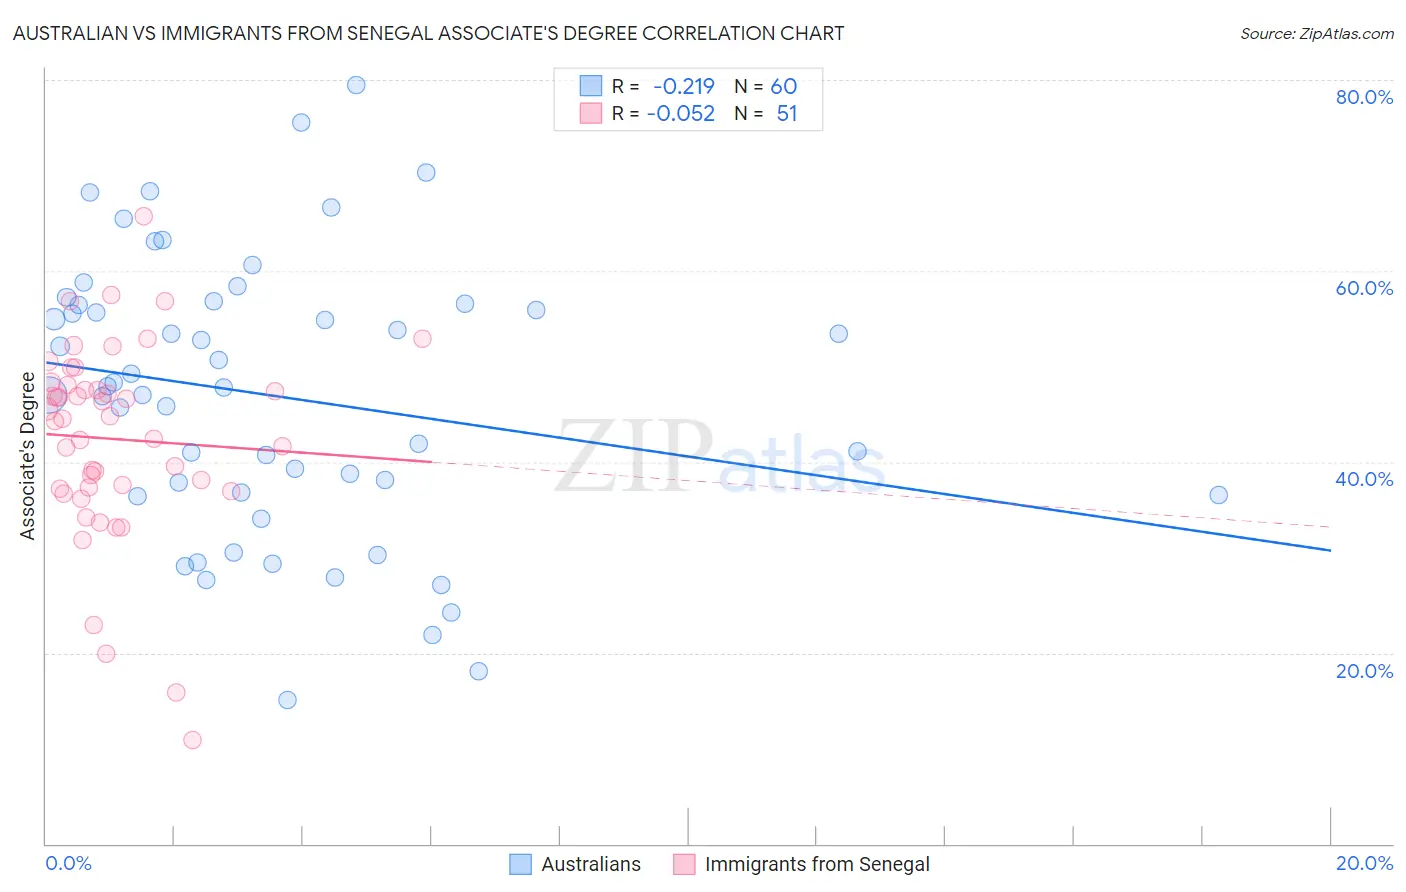
Australian vs Immigrants from Senegal Associate's Degree Correlation Chart
The statistical analysis conducted on geographies consisting of 224,144,542 people shows a weak negative correlation between the proportion of Australians and percentage of population with at least associate's degree education in the United States with a correlation coefficient (R) of -0.219 and weighted average of 51.9%. Similarly, the statistical analysis conducted on geographies consisting of 90,125,204 people shows a slight negative correlation between the proportion of Immigrants from Senegal and percentage of population with at least associate's degree education in the United States with a correlation coefficient (R) of -0.052 and weighted average of 45.2%, a difference of 14.8%.
Associate's Degree Correlation Summary
| Measurement | Australian | Immigrants from Senegal |
| Minimum | 15.1% | 10.9% |
| Maximum | 79.5% | 65.7% |
| Range | 64.4% | 54.8% |
| Mean | 47.0% | 42.4% |
| Median | 47.9% | 44.5% |
| Interquartile 25% (IQ1) | 36.7% | 37.2% |
| Interquartile 75% (IQ3) | 56.5% | 48.1% |
| Interquartile Range (IQR) | 19.8% | 10.9% |
| Standard Deviation (Sample) | 14.6% | 10.3% |
| Standard Deviation (Population) | 14.4% | 10.2% |
Similar Demographics by Associate's Degree
Demographics Similar to Australians by Associate's Degree
In terms of associate's degree, the demographic groups most similar to Australians are Immigrants from Czechoslovakia (51.9%, a difference of 0.020%), Immigrants from Spain (51.9%, a difference of 0.030%), Immigrants from Asia (52.0%, a difference of 0.13%), Paraguayan (51.8%, a difference of 0.14%), and Bolivian (52.0%, a difference of 0.16%).
| Demographics | Rating | Rank | Associate's Degree |
| Immigrants | Norway | 99.9 /100 | #48 | Exceptional 52.2% |
| Immigrants | Austria | 99.9 /100 | #49 | Exceptional 52.1% |
| Asians | 99.9 /100 | #50 | Exceptional 52.1% |
| Immigrants | Greece | 99.9 /100 | #51 | Exceptional 52.1% |
| Bolivians | 99.8 /100 | #52 | Exceptional 52.0% |
| Immigrants | Asia | 99.8 /100 | #53 | Exceptional 52.0% |
| Immigrants | Spain | 99.8 /100 | #54 | Exceptional 51.9% |
| Australians | 99.8 /100 | #55 | Exceptional 51.9% |
| Immigrants | Czechoslovakia | 99.8 /100 | #56 | Exceptional 51.9% |
| Paraguayans | 99.8 /100 | #57 | Exceptional 51.8% |
| New Zealanders | 99.8 /100 | #58 | Exceptional 51.8% |
| Immigrants | Serbia | 99.8 /100 | #59 | Exceptional 51.7% |
| Immigrants | Bolivia | 99.7 /100 | #60 | Exceptional 51.5% |
| Immigrants | Kazakhstan | 99.7 /100 | #61 | Exceptional 51.4% |
| Bhutanese | 99.7 /100 | #62 | Exceptional 51.4% |
Demographics Similar to Immigrants from Senegal by Associate's Degree
In terms of associate's degree, the demographic groups most similar to Immigrants from Senegal are Senegalese (45.2%, a difference of 0.010%), Immigrants from Bangladesh (45.2%, a difference of 0.020%), Immigrants from Vietnam (45.2%, a difference of 0.040%), Spaniard (45.2%, a difference of 0.090%), and Immigrants from South Eastern Asia (45.2%, a difference of 0.11%).
| Demographics | Rating | Rank | Associate's Degree |
| Celtics | 33.3 /100 | #192 | Fair 45.8% |
| Immigrants | Cameroon | 31.0 /100 | #193 | Fair 45.7% |
| Immigrants | Peru | 27.6 /100 | #194 | Fair 45.5% |
| Germans | 26.5 /100 | #195 | Fair 45.5% |
| French | 25.6 /100 | #196 | Fair 45.4% |
| Scotch-Irish | 22.3 /100 | #197 | Fair 45.3% |
| Immigrants | Bangladesh | 21.3 /100 | #198 | Fair 45.2% |
| Immigrants | Senegal | 21.2 /100 | #199 | Fair 45.2% |
| Senegalese | 21.1 /100 | #200 | Fair 45.2% |
| Immigrants | Vietnam | 20.8 /100 | #201 | Fair 45.2% |
| Spaniards | 20.4 /100 | #202 | Fair 45.2% |
| Immigrants | South Eastern Asia | 20.2 /100 | #203 | Fair 45.2% |
| Nigerians | 19.1 /100 | #204 | Poor 45.1% |
| Immigrants | Thailand | 18.9 /100 | #205 | Poor 45.1% |
| German Russians | 18.9 /100 | #206 | Poor 45.1% |