Immigrants from Honduras vs Immigrants from Senegal Associate's Degree
COMPARE
Immigrants from Honduras
Immigrants from Senegal
Associate's Degree
Associate's Degree Comparison
Immigrants from Honduras
Immigrants from Senegal
38.5%
ASSOCIATE'S DEGREE
0.0/ 100
METRIC RATING
305th/ 347
METRIC RANK
45.2%
ASSOCIATE'S DEGREE
21.2/ 100
METRIC RATING
199th/ 347
METRIC RANK
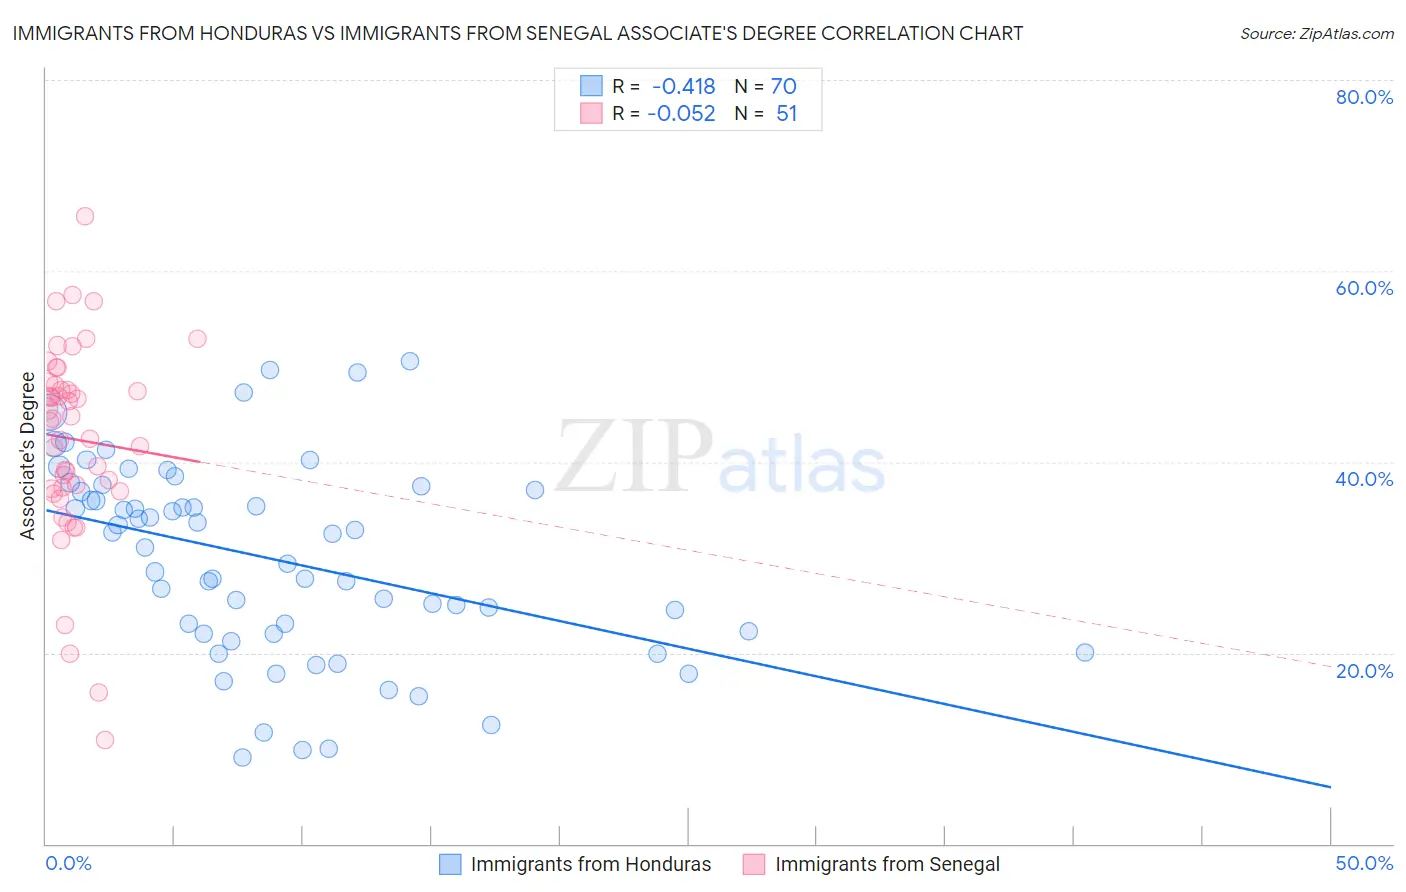
Immigrants from Honduras vs Immigrants from Senegal Associate's Degree Correlation Chart
The statistical analysis conducted on geographies consisting of 322,624,336 people shows a moderate negative correlation between the proportion of Immigrants from Honduras and percentage of population with at least associate's degree education in the United States with a correlation coefficient (R) of -0.418 and weighted average of 38.5%. Similarly, the statistical analysis conducted on geographies consisting of 90,125,204 people shows a slight negative correlation between the proportion of Immigrants from Senegal and percentage of population with at least associate's degree education in the United States with a correlation coefficient (R) of -0.052 and weighted average of 45.2%, a difference of 17.6%.
Associate's Degree Correlation Summary
| Measurement | Immigrants from Honduras | Immigrants from Senegal |
| Minimum | 9.0% | 10.9% |
| Maximum | 50.5% | 65.7% |
| Range | 41.5% | 54.8% |
| Mean | 29.8% | 42.4% |
| Median | 31.8% | 44.5% |
| Interquartile 25% (IQ1) | 22.0% | 37.2% |
| Interquartile 75% (IQ3) | 37.1% | 48.1% |
| Interquartile Range (IQR) | 15.0% | 10.9% |
| Standard Deviation (Sample) | 10.2% | 10.3% |
| Standard Deviation (Population) | 10.1% | 10.2% |
Similar Demographics by Associate's Degree
Demographics Similar to Immigrants from Honduras by Associate's Degree
In terms of associate's degree, the demographic groups most similar to Immigrants from Honduras are Sioux (38.5%, a difference of 0.070%), Shoshone (38.4%, a difference of 0.070%), Immigrants from El Salvador (38.4%, a difference of 0.11%), Guatemalan (38.5%, a difference of 0.12%), and Colville (38.5%, a difference of 0.21%).
| Demographics | Rating | Rank | Associate's Degree |
| Cheyenne | 0.0 /100 | #298 | Tragic 38.7% |
| Ute | 0.0 /100 | #299 | Tragic 38.6% |
| Chickasaw | 0.0 /100 | #300 | Tragic 38.6% |
| Tsimshian | 0.0 /100 | #301 | Tragic 38.6% |
| Colville | 0.0 /100 | #302 | Tragic 38.5% |
| Guatemalans | 0.0 /100 | #303 | Tragic 38.5% |
| Sioux | 0.0 /100 | #304 | Tragic 38.5% |
| Immigrants | Honduras | 0.0 /100 | #305 | Tragic 38.5% |
| Shoshone | 0.0 /100 | #306 | Tragic 38.4% |
| Immigrants | El Salvador | 0.0 /100 | #307 | Tragic 38.4% |
| Mexican American Indians | 0.0 /100 | #308 | Tragic 38.2% |
| Immigrants | Guatemala | 0.0 /100 | #309 | Tragic 38.1% |
| Immigrants | Dominican Republic | 0.0 /100 | #310 | Tragic 37.9% |
| Immigrants | Latin America | 0.0 /100 | #311 | Tragic 37.9% |
| Choctaw | 0.0 /100 | #312 | Tragic 37.8% |
Demographics Similar to Immigrants from Senegal by Associate's Degree
In terms of associate's degree, the demographic groups most similar to Immigrants from Senegal are Senegalese (45.2%, a difference of 0.010%), Immigrants from Bangladesh (45.2%, a difference of 0.020%), Immigrants from Vietnam (45.2%, a difference of 0.040%), Spaniard (45.2%, a difference of 0.090%), and Immigrants from South Eastern Asia (45.2%, a difference of 0.11%).
| Demographics | Rating | Rank | Associate's Degree |
| Celtics | 33.3 /100 | #192 | Fair 45.8% |
| Immigrants | Cameroon | 31.0 /100 | #193 | Fair 45.7% |
| Immigrants | Peru | 27.6 /100 | #194 | Fair 45.5% |
| Germans | 26.5 /100 | #195 | Fair 45.5% |
| French | 25.6 /100 | #196 | Fair 45.4% |
| Scotch-Irish | 22.3 /100 | #197 | Fair 45.3% |
| Immigrants | Bangladesh | 21.3 /100 | #198 | Fair 45.2% |
| Immigrants | Senegal | 21.2 /100 | #199 | Fair 45.2% |
| Senegalese | 21.1 /100 | #200 | Fair 45.2% |
| Immigrants | Vietnam | 20.8 /100 | #201 | Fair 45.2% |
| Spaniards | 20.4 /100 | #202 | Fair 45.2% |
| Immigrants | South Eastern Asia | 20.2 /100 | #203 | Fair 45.2% |
| Nigerians | 19.1 /100 | #204 | Poor 45.1% |
| Immigrants | Thailand | 18.9 /100 | #205 | Poor 45.1% |
| German Russians | 18.9 /100 | #206 | Poor 45.1% |