Aleut vs Menominee Associate's Degree
COMPARE
Aleut
Menominee
Associate's Degree
Associate's Degree Comparison
Aleuts
Menominee
39.6%
ASSOCIATE'S DEGREE
0.0/ 100
METRIC RATING
287th/ 347
METRIC RANK
36.7%
ASSOCIATE'S DEGREE
0.0/ 100
METRIC RATING
325th/ 347
METRIC RANK
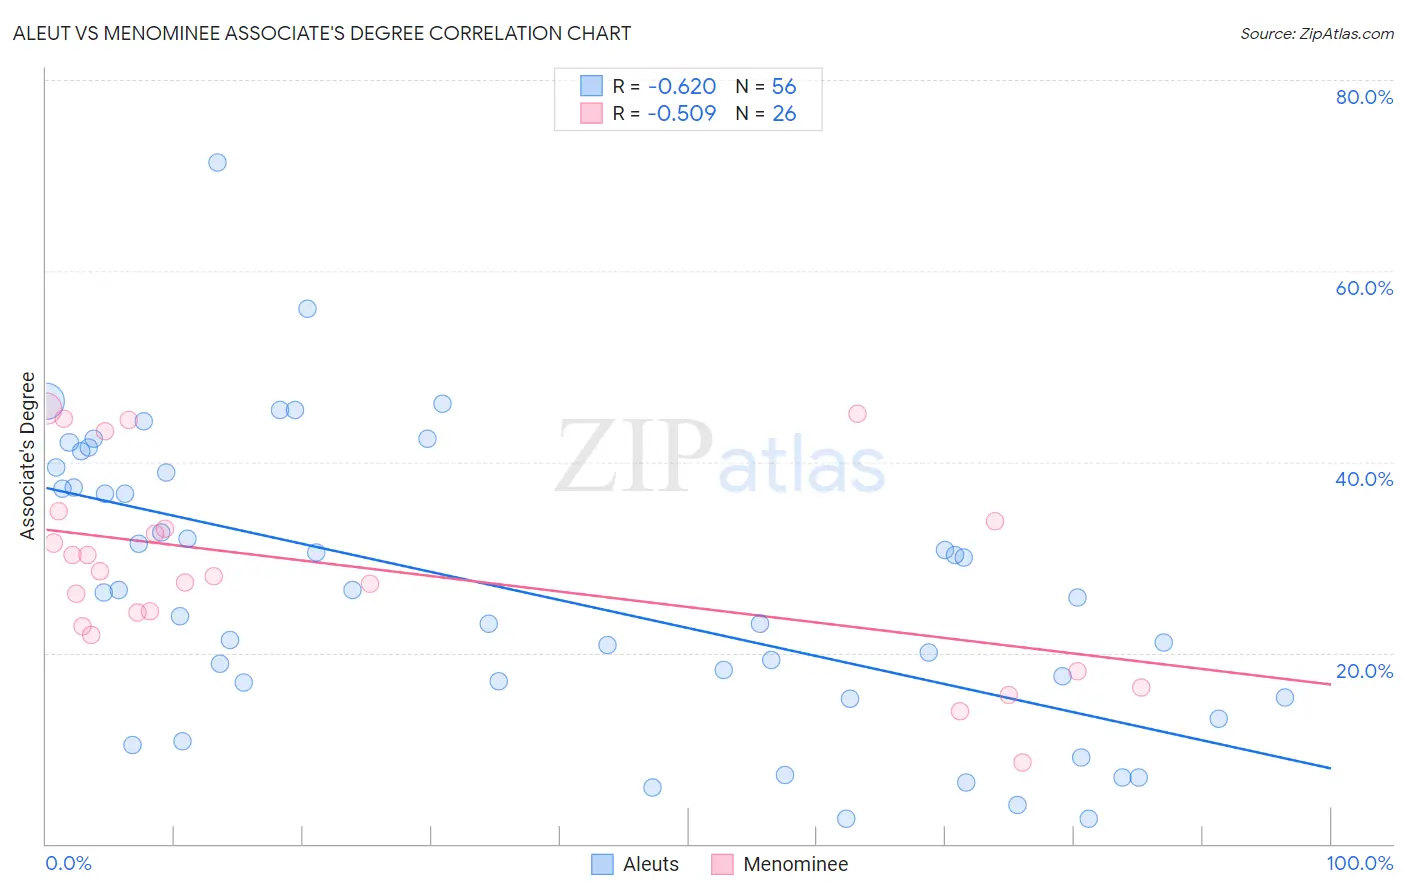
Aleut vs Menominee Associate's Degree Correlation Chart
The statistical analysis conducted on geographies consisting of 61,782,803 people shows a significant negative correlation between the proportion of Aleuts and percentage of population with at least associate's degree education in the United States with a correlation coefficient (R) of -0.620 and weighted average of 39.6%. Similarly, the statistical analysis conducted on geographies consisting of 45,778,979 people shows a substantial negative correlation between the proportion of Menominee and percentage of population with at least associate's degree education in the United States with a correlation coefficient (R) of -0.509 and weighted average of 36.7%, a difference of 8.1%.
Associate's Degree Correlation Summary
| Measurement | Aleut | Menominee |
| Minimum | 2.6% | 8.5% |
| Maximum | 71.3% | 45.6% |
| Range | 68.7% | 37.1% |
| Mean | 26.6% | 28.9% |
| Median | 26.0% | 28.3% |
| Interquartile 25% (IQ1) | 16.1% | 22.8% |
| Interquartile 75% (IQ3) | 38.1% | 33.8% |
| Interquartile Range (IQR) | 22.0% | 11.0% |
| Standard Deviation (Sample) | 14.9% | 10.1% |
| Standard Deviation (Population) | 14.8% | 9.9% |
Similar Demographics by Associate's Degree
Demographics Similar to Aleuts by Associate's Degree
In terms of associate's degree, the demographic groups most similar to Aleuts are Immigrants from Cuba (39.5%, a difference of 0.24%), Immigrants from Caribbean (39.7%, a difference of 0.26%), Central American (39.4%, a difference of 0.50%), Immigrants from Belize (39.9%, a difference of 0.60%), and Comanche (39.9%, a difference of 0.70%).
| Demographics | Rating | Rank | Associate's Degree |
| Immigrants | Micronesia | 0.1 /100 | #280 | Tragic 40.2% |
| Immigrants | Portugal | 0.1 /100 | #281 | Tragic 40.1% |
| Bangladeshis | 0.1 /100 | #282 | Tragic 40.0% |
| Haitians | 0.1 /100 | #283 | Tragic 40.0% |
| Comanche | 0.1 /100 | #284 | Tragic 39.9% |
| Immigrants | Belize | 0.1 /100 | #285 | Tragic 39.9% |
| Immigrants | Caribbean | 0.0 /100 | #286 | Tragic 39.7% |
| Aleuts | 0.0 /100 | #287 | Tragic 39.6% |
| Immigrants | Cuba | 0.0 /100 | #288 | Tragic 39.5% |
| Central Americans | 0.0 /100 | #289 | Tragic 39.4% |
| Immigrants | Haiti | 0.0 /100 | #290 | Tragic 39.3% |
| Dominicans | 0.0 /100 | #291 | Tragic 39.3% |
| Blacks/African Americans | 0.0 /100 | #292 | Tragic 39.1% |
| Nepalese | 0.0 /100 | #293 | Tragic 39.0% |
| Salvadorans | 0.0 /100 | #294 | Tragic 39.0% |
Demographics Similar to Menominee by Associate's Degree
In terms of associate's degree, the demographic groups most similar to Menominee are Arapaho (36.7%, a difference of 0.11%), Immigrants from Cabo Verde (36.8%, a difference of 0.27%), Kiowa (36.5%, a difference of 0.56%), Dutch West Indian (36.5%, a difference of 0.58%), and Alaskan Athabascan (36.5%, a difference of 0.59%).
| Demographics | Rating | Rank | Associate's Degree |
| Alaska Natives | 0.0 /100 | #318 | Tragic 37.5% |
| Fijians | 0.0 /100 | #319 | Tragic 37.4% |
| Cajuns | 0.0 /100 | #320 | Tragic 37.4% |
| Immigrants | Yemen | 0.0 /100 | #321 | Tragic 37.3% |
| Pennsylvania Germans | 0.0 /100 | #322 | Tragic 37.2% |
| Immigrants | Cabo Verde | 0.0 /100 | #323 | Tragic 36.8% |
| Arapaho | 0.0 /100 | #324 | Tragic 36.7% |
| Menominee | 0.0 /100 | #325 | Tragic 36.7% |
| Kiowa | 0.0 /100 | #326 | Tragic 36.5% |
| Dutch West Indians | 0.0 /100 | #327 | Tragic 36.5% |
| Alaskan Athabascans | 0.0 /100 | #328 | Tragic 36.5% |
| Paiute | 0.0 /100 | #329 | Tragic 36.4% |
| Apache | 0.0 /100 | #330 | Tragic 36.2% |
| Immigrants | Azores | 0.0 /100 | #331 | Tragic 35.6% |
| Immigrants | Central America | 0.0 /100 | #332 | Tragic 35.0% |